


Solana (SOLUSD) Is down 1.08% on Aug 14: Why It Happened



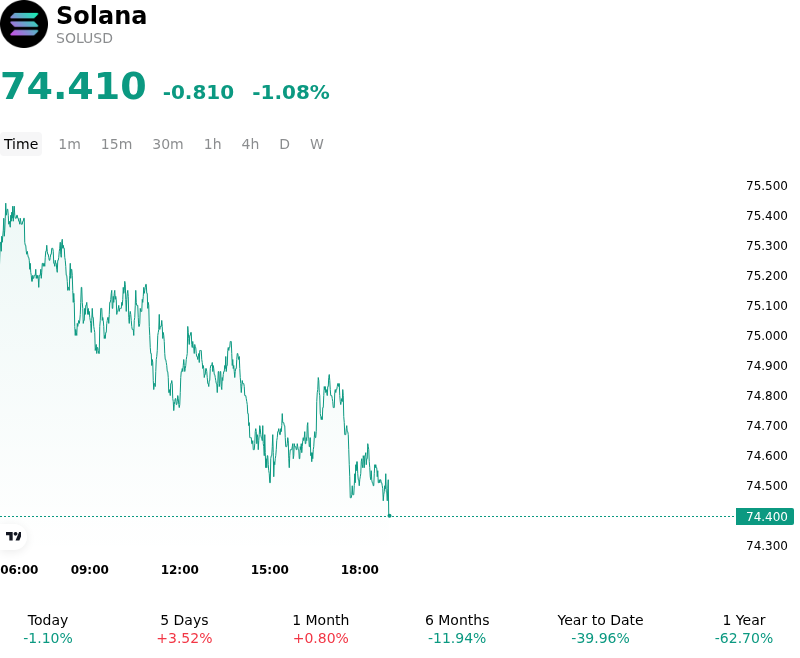
Solana (SOLUSD) is down 1.08% at Aug 14 07:00(ET), now at $74.41, with a 7-day up of 2.17%.
What is driving Solana (SOLUSD)’s stock price down today?
Solana experienced downward volatility as fading spot demand met firm overhead technical resistance near key psychological levels, coinciding with a broader consolidation across digital asset markets. Despite supportive macroeconomic prints, including cooling wholesale inflation data that lowered Treasury yields, capital flows into high-beta Layer-1 tokens remained constrained. The pullback in price action reflects tactical profit taking and leverage reduction in derivatives markets following a failed attempt to build sustained upside momentum above immediate resistance zones.
On-chain dynamics and operational considerations also influenced market sentiment during the session. While long-term institutional backing remains evident through spot ETF demand and corporate treasury accumulation, recent validator routing issues highlighted structural dependencies within the network's infrastructure footprint. Although block production continued uninterrupted and consensus thresholds were preserved, the temporary surge in delinquent staked assets prompted institutional desks and automated market makers to temporarily widen bid-ask spreads and reduce active liquidity provisioning.
From a structural perspective, the intraday decline appears to be a temporary liquidity-driven retracement rather than a breakdown in fundamental network utility. Derivatives positioning indicates that speculative leverage has been partially flushed, bringing futures open interest closer to neutral levels. Market participants continue to monitor critical support zones, assessing whether key protocol upgrades designed to optimize slot times and finality will reignite spot accumulation. Key macro risks, including pending regulatory legislation and overall crypto market liquidity, remain central to broader directional bias.
Technical Analysis of Solana (SOLUSD)
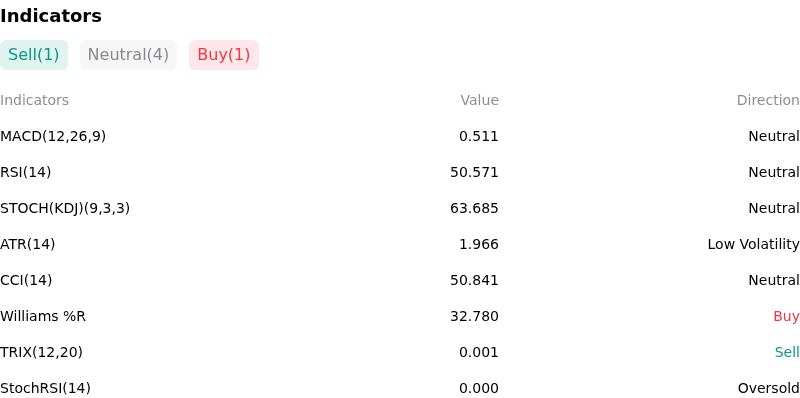
Technically, Solana (SOLUSD) shows a MACD (12,26,9) value of 0.511, indicating a neutral signal. The RSI at 50.571 suggests neutral condition and the Williams %R at 32.780 suggests buy condition. Please monitor closely.
More details about Solana (SOLUSD)
Recent Events and Risks:
- FTX/Alameda Unlocked Supply Transfer: On August 11, 2026, an Alameda Research-linked staking address unlocked 201,741 SOL (worth roughly $15.2 million) and moved the funds across multiple transactions to BitGo custody for FTX bankruptcy estate distributions. Market participants are concerned that onward sales of these residual holdings to fund creditor payouts could create spot supply overhang and near-term selling pressure.
- Overleveraged Long Bias and Liquidation Squeeze Exposure: Derivatives data reveals Solana perpetual futures open interest climbing toward $4.94 billion with trader positioning heavily skewed at a 69% long bias. This aggressive crowding leaves SOL vulnerable to a sharp long-squeeze liquidation cascade if the token breaks down below key immediate support between $73.50 and $75.00.
- Regulatory Shock and Broader Market Risk-Off Drag: Digital asset sentiment deteriorated following the SEC's abrupt cancellation of a scheduled cryptocurrency rulemaking meeting, causing total crypto market capitalization to slip 1.19% and pushing Bitcoin below $63,000. Broader risk-off sentiment creates headwinds for SOL, which continues to trade below its 200-day moving average near $83.70.
- Whale Inflows to Centralized Exchanges: On-chain monitoring detected multi-million dollar transfers of SOL from dormant whale addresses into centralized exchange hot wallets, indicating potential profit-taking positioning. In an environment of thin buy-side liquidity, these exchange inflows increase the risk of localized order book imbalances and intraday downside spikes.
This article may include AI-generated content that is human-reviewed, which is for reference and general information purposes only and does not constitute investment advice.
Recommended Articles









Comments (0)
Click the $ button, enter the symbol, and select to link a stock, ETF, or other ticker.