


Cencora Inc Stock (COR) Closed Down by 5.92% on Aug 12: Key Drivers Unveiled



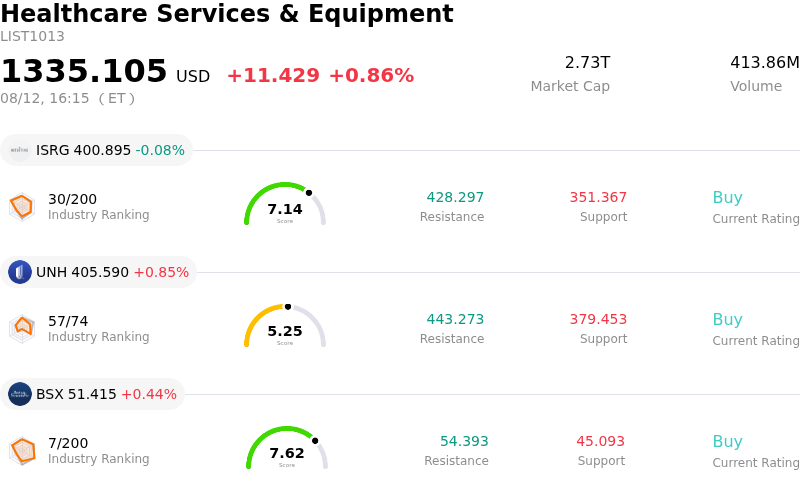
Cencora Inc (COR) closed down by 5.92%. The Healthcare Services & Equipment sector is up by 0.86%. The company underperformed the industry. Top 3 stocks by turnover in the sector: Intuitive Surgical Inc (ISRG) down 0.08%; Unitedhealth Group Inc (UNH) up 0.85%; Boston Scientific Corp (BSX) up 0.44%.
What is driving Cencora Inc (COR)’s stock price down today?
The primary driver behind Cencora's sharp downward stock movement was the company's confirmation that a portion of pharmaceutical volume associated with Walgreens, outside of its primary supply contract, began transitioning to competing distributors. Although management emphasized that the core prime vendor agreement with Walgreens remains fully intact and represents the vast majority of their commercial relationship, the disclosure rattled investor confidence. Market participants reacted strongly to the explicit evidence of customer volume loss, raising fresh concerns over near-term revenue momentum and client retention in a highly competitive pharmaceutical distribution market.
The decline unfolded despite management reiterating its full-year earnings per share outlook, reassuring the market that the volume transition was anticipated and already embedded in previous operational forecasts. However, investors remain sensitive to top-line vulnerabilities following earlier guidance adjustments that highlighted headwinds from wholesale price reductions, customer volume shifts, and slowing growth in lower-margin weight-loss medications. While the company's recent strategic pivot toward higher-margin specialty services and clinical acquisitions continues to support underlying profitability, top-line growth uncertainty continues to dominate short-term trading sentiment.
The selling pressure was concentrated strictly within Cencora rather than reflecting broader macroeconomic or healthcare sector weakness, as equity indexes and industry peers remained relatively stable. Additional headwinds, including recent executive stock sale disclosures and cautious institutional positioning, outweighed recent positive analyst target adjustments. Consequently, the market prioritized near-term revenue trajectory risks over stable guidance, driving a pronounced intraday pullback as investors recalibrated growth expectations.
Technical Analysis of Cencora Inc (COR)
Technically, Cencora Inc (COR) shows a MACD (12,26,9) value of 2.444, indicating a buy signal. The RSI at 69.609 suggests neutral condition and the Williams %R at 0.225 suggests overbought condition. Please monitor closely.
Media Coverage of Cencora Inc (COR)
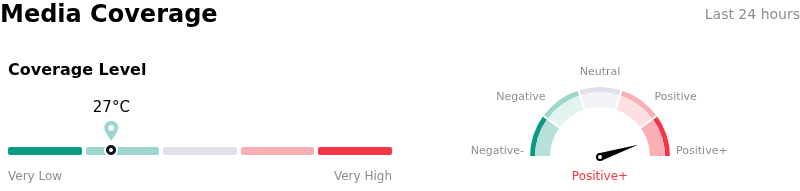
In terms of media coverage, Cencora Inc (COR) shows a coverage score of 27, indicating a low level of media attention. The overall market sentiment index is currently in extremely bullish zone.
Fundamental Analysis of Cencora Inc (COR)
Cencora Inc (COR) is in the Healthcare Services & Equipment industry. Its latest annual revenue is $321.33B, ranking 1 in the industry. The net profit is $1.55B, ranking 11 in the industry. Company Profile
Over the past month, multiple analysts have rated the company as Buy, with an average price target of $369.09, a high of $430.00, and a low of $330.00.
More details about Cencora Inc (COR)
Company Specific Risks:
- Loss of Non-Core Walgreens Business Operations: Cencora disclosed in an SEC regulatory filing that certain business operations previously serving primary customer Walgreens began transferring to third parties, triggering an immediate intraday share price gap-down and raising investor concerns regarding account retention.
- Subdued Revenue Guidance and Drug Pricing Headwinds: Top-line growth expectations for fiscal 2026 remain restricted to 4%–6% due to lower wholesale acquisition pricing, Inflation Reduction Act price adjustments, rapid brand-to-generic conversions, and decelerating volume growth in GLP-1 treatments.
- Sharply Escalating Net Interest Expenses: Quarterly financial reports revealed a 72.0% year-over-year surge in net interest expense to $140.7 million, driven by elevated debt obligations from senior notes and variable-rate loans, imposing earnings drag on a low-margin wholesale model.
- Asset Impairments and Operating Cost Inflation: The company recognized a $249.5 million impairment charge on assets held for sale within its U.S. Consulting Services unit, accompanied by a 21.9% increase in quarterly operating expenses from litigation, restructuring, and acquisition costs.
This article may include AI-generated content that is human-reviewed, which is for reference and general information purposes only and does not constitute investment advice.
Recommended Articles









Comments (0)
Click the $ button, enter the symbol, and select to link a stock, ETF, or other ticker.