


Lam Research Corp Stock (LRCX) Opened Up by 4.92% on Aug 12: What Investors Need To Know



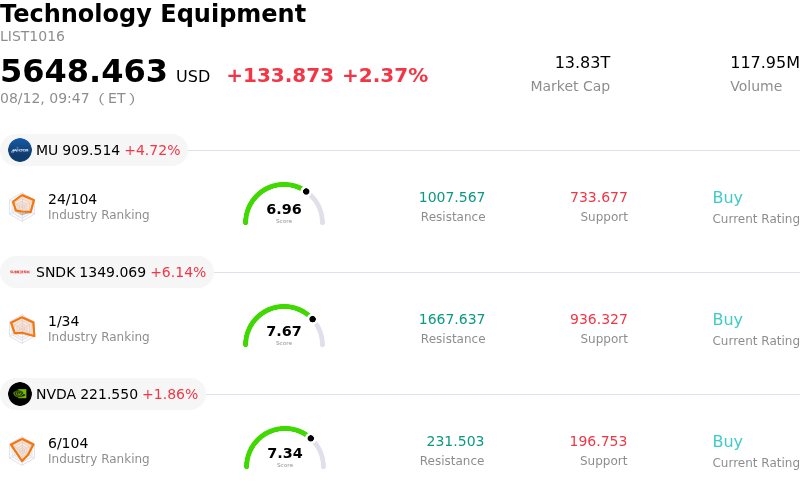
Lam Research Corp (LRCX) opened up by 4.92%. The Technology Equipment sector is up by 2.37%. The company outperformed the industry. Top 3 stocks by turnover in the sector: Micron Technology Inc (MU) up 4.72%; SanDisk Corporation (SNDK) up 6.14%; NVIDIA Corp (NVDA) up 1.86%.
What is driving Lam Research Corp (LRCX)’s stock price up today?
Lam Research experienced notable upward momentum driven by strong structural tailwinds across the semiconductor capital equipment sector. The broader market continues to re-evaluate equipment suppliers favorably as ongoing artificial intelligence infrastructure buildouts demand higher memory capacity, advanced packaging, and leading-edge process nodes. Increased capital spending commitments across major memory and logic manufacturers have created a robust demand environment for specialized etching and deposition technologies, fueling bullish investor sentiment.
This positive price action builds on the company's recent fundamental performance, which demonstrated record gross margins and stronger-than-expected forward guidance. Management's upward revision of the global wafer fab equipment spending outlook, combined with a sharp sequential surge in NAND memory demand and high-bandwidth memory expansion, has bolstered confidence in the company's long-term growth trajectory. Wall Street analysts have responded by raising forward earnings estimates and upgrading stock ratings, reinforcing institutional buying interest.
Adding to the positive catalyst, Lam Research announced a strategic collaboration deploying its virtual fabrication solutions for regional semiconductor workforce development. This initiative underscores the company's technical leadership and deepening ecosystem partnerships. Despite typical intraday volatility associated with high-beta technology equities, the convergence of favorable analyst revisions, strong corporate guidance, and sustained AI hardware momentum provided a solid foundation for the upward stock movement.
Technical Analysis of Lam Research Corp (LRCX)
Technically, Lam Research Corp (LRCX) shows a MACD (12,26,9) value of 6.170, indicating a neutral signal. The RSI at 48.913 suggests neutral condition and the Williams %R at 19.196 suggests overbought condition. Please monitor closely.
Media Coverage of Lam Research Corp (LRCX)
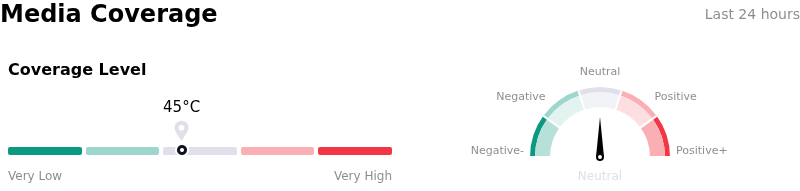
In terms of media coverage, Lam Research Corp (LRCX) shows a coverage score of 45, indicating a moderate level of media attention. The overall market sentiment index is currently in neutral zone.
Fundamental Analysis of Lam Research Corp (LRCX)
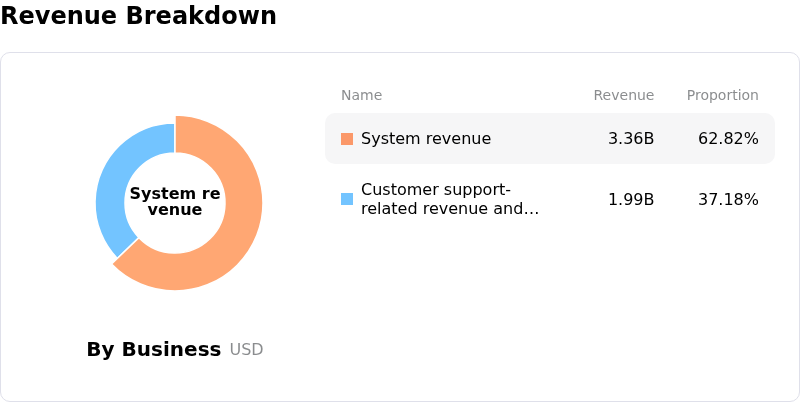
Lam Research Corp (LRCX) is in the Technology Equipment industry. Its latest annual revenue is $23.23B, ranking 12 in the industry. The net profit is $7.27B, ranking 7 in the industry. Company Profile
Over the past month, multiple analysts have rated the company as Buy, with an average price target of $366.38, a high of $500.00, and a low of $213.00.
More details about Lam Research Corp (LRCX)
Company Specific Risks:
- Elevated Valuation Multiple Vulnerability: Lam Research trades at an elevated valuation of over 53x earnings, exceeding peer and semiconductor equipment industry averages, leaving the stock vulnerable to intraday pullbacks if growth or margin execution falls short of elevated market expectations.
- China Trade and Export Regulation Exposure: FY26 Form 10-K regulatory disclosures emphasize that China remains the firm's largest geographic market by revenue ($7.86B), exposing top-line performance to downside risk if U.S. export controls and trade restrictions tighten further.
- Operational Lead-Time and Margin Constraints: Financial analysis highlights near-term supply chain lead-time challenges and gross margin constraints, creating operational hurdles as management works toward achieving long-term target margins.
- Executive Insider Share Dispositions: SEC regulatory filings indicate recent insider liquidation by senior executive officers under pre-arranged Rule 10b5-1 trading plans, contributing to negative sentiment and potential price overhang during volatile trading sessions.
This article may include AI-generated content that is human-reviewed, which is for reference and general information purposes only and does not constitute investment advice.
Recommended Articles









Comments (0)
Click the $ button, enter the symbol, and select to link a stock, ETF, or other ticker.