


Life360 Inc Stock (LIF) Moved Down by 24.38% on Aug 11: Key Drivers Unveiled



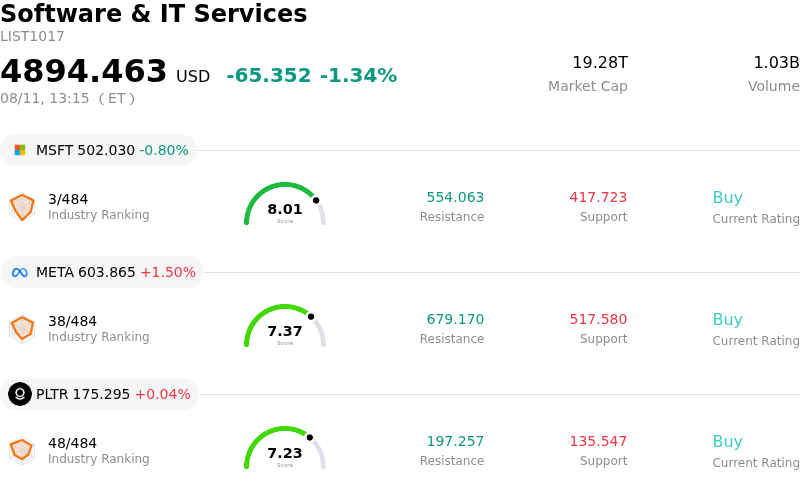
Life360 Inc (LIF) moved down by 24.38%. The Software & IT Services sector is down by 1.34%. The company underperformed the industry. Top 3 stocks by turnover in the sector: Microsoft Corp (MSFT) down 0.80%; Meta Platforms Inc (META) up 1.50%; Palantir Technologies Inc (PLTR) down 0.01%.
What is driving Life360 Inc (LIF)’s stock price down today?
Life360 experienced a significant downward trajectory accompanied by elevated intraday volatility following the release of its second-quarter financial results. Although the company achieved strong top-line revenue growth and crossed key operational milestones, including surpassing one hundred million monthly active users, investor reaction turned sharply negative. Market participants focused primarily on profitability metrics and forward guidance. While subscription revenue performed well, diluted earnings per share fell short of consensus estimates due to margin mix effects and shifting operating expenses. Furthermore, management merely reiterated its full-year total revenue guidance rather than raising it, while simultaneously trimming hardware revenue projections. After a strong advance leading up to the earnings report, the lack of an upward revision to full-year sales targets led to immediate profit-taking and a sharp repricing of growth expectations.
The selloff was further exacerbated by concerns surrounding corporate insider transactions and valuation contraction. SEC filings in the days leading up to the earnings announcement revealed notable equity sales by company executives and board members under pre-arranged trading plans. In an environment where the stock had been trading at elevated multiples following an extended rally, persistent insider selling signaled caution to institutional and retail investors alike. The combination of modest GAAP profitability, insider liquidation, and high valuation multiples created a vulnerable setup, causing investors to reassess the company's near-term risk-reward profile and triggering widespread liquidation.
Broader macroeconomic conditions and technology sector sentiment also contributed to the sharp decline and heightened intraday fluctuations. Heightened risk-off sentiment across the software and tech space compounded company-specific pressures, as investors moved away from high-beta growth names facing margin uncertainties. Despite long-term growth opportunities in international expansion and advertising monetization, the immediate market narrative shifted toward defensive repositioning, leading to heavy trading volume and downward momentum.
Technical Analysis of Life360 Inc (LIF)
Technically, Life360 Inc (LIF) shows a MACD (12,26,9) value of 1.720, indicating a buy signal. The RSI at 65.175 suggests neutral condition and the Williams %R at 5.551 suggests overbought condition. Please monitor closely.
Fundamental Analysis of Life360 Inc (LIF)
Life360 Inc (LIF) is in the Software & IT Services industry. Its latest annual revenue is $489.48M, ranking 269 in the industry. The net profit is $150.83M, ranking 116 in the industry. Company Profile
Over the past month, multiple analysts have rated the company as Buy, with an average price target of $63.32, a high of $72.00, and a low of $42.00.
More details about Life360 Inc (LIF)
Company Specific Risks:
- Quarterly Profitability and Earnings Miss: Life360 posted Q2 GAAP earnings per share of $0.06, missing consensus Wall Street expectations of $0.08, while near-breakeven operating income underscored ongoing expense pressures and margin compression despite higher top-line subscriber growth.
- Hardware Revenue Guidance Downgrade: Management lowered its full-year hardware revenue target to $35 million–$45 million while merely maintaining its total revenue outlook of $650 million–$685 million, failing to meet heightened institutional expectations for full-year top-line acceleration.
- Executive and Insider Equity Dispositions: SEC filings, including recent Form 144 submissions, revealed over $6.5 million in insider stock sales over the past three months, including multi-thousand-share liquidations by corporate directors and executive officers that stoked market anxiety regarding internal valuation sentiment.
- Severe Valuation Multiple Contraction: The stock's single-day intraday drop of over 25% signals significant institutional repricing, driven by low return on equity (6.80%) and market skepticism regarding the company's ability to translate user expansion into long-term net margin sustainability.
This article may include AI-generated content that is human-reviewed, which is for reference and general information purposes only and does not constitute investment advice.
Recommended Articles








Comments (0)
Click the $ button, enter the symbol, and select to link a stock, ETF, or other ticker.