


Constellation Energy Corp Stock (CEG) Moved Up by 3.25% on Aug 11: What Signal Does It Send?



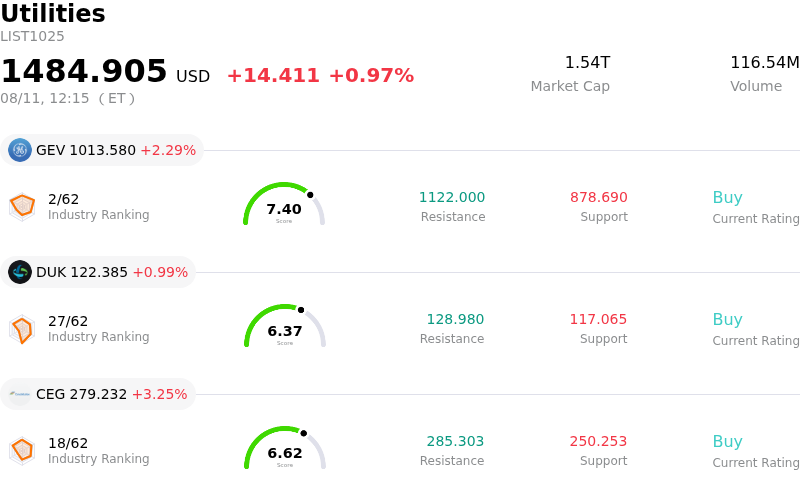
Constellation Energy Corp (CEG) moved up by 3.25%. The Utilities sector is up by 0.97%. The company outperformed the industry. Top 3 stocks by turnover in the sector: Ge Vernova Inc (GEV) up 2.29%; Duke Energy Corp (DUK) up 0.99%; Constellation Energy Corp (CEG) up 3.25%.
What is driving Constellation Energy Corp (CEG)’s stock price up today?
Constellation Energy experienced notable upward momentum driven by ongoing market digestion of its strong second-quarter financial performance and raised full-year guidance. The utility leader delivered an adjusted operating earnings beat that reflected solid operational execution across its power generation fleet and accretive contributions from its Calpine acquisition. Higher capacity revenue within the PJM market, alongside disciplined portfolio optimization and expanding customer margins, allowed management to raise its full-year adjusted operating earnings target, reinforcing investor confidence in the company's underlying earnings power.
Beyond core quarterly results, long-term commercial momentum in clean energy supply contracts continues to serve as a primary catalyst for institutional accumulation. The company expanded its contracted clean baseload profile through new long-term nuclear power purchase agreements with corporate buyers, pushing total contracted clean capacity closer to thirty percent. Progress on key regulatory and licensing fronts, including Federal Energy Regulatory Commission approvals and Nuclear Regulatory Commission fuel licensing for the Crane Clean Energy Center restart, has further validated management's strategic focus on meeting surge demand for reliable baseload power from tech infrastructure and data center operators.
Positive Wall Street commentary and capital allocation execution have added further tailwinds to stock performance. Following the earnings update, multiple equity research analysts reiterated bullish ratings and premium price targets, pointing to a resilient multi-year growth trajectory backed by long-term contracting and federal clean energy tax credits. Additionally, ongoing execution under the company's multi-billion dollar share repurchase program provides steady structural demand for shares, helping absorb short-term volatility and lifting market sentiment across the broader power and utilities sector.
Technical Analysis of Constellation Energy Corp (CEG)
Technically, Constellation Energy Corp (CEG) shows a MACD (12,26,9) value of 1.325, indicating a buy signal. The RSI at 55.218 suggests neutral condition and the Williams %R at 40.143 suggests buy condition. Please monitor closely.
Media Coverage of Constellation Energy Corp (CEG)
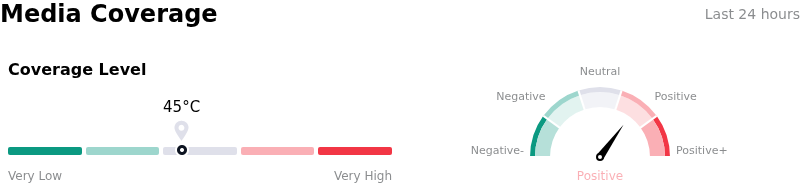
In terms of media coverage, Constellation Energy Corp (CEG) shows a coverage score of 45, indicating a moderate level of media attention. The overall market sentiment index is currently in bullish zone.
Fundamental Analysis of Constellation Energy Corp (CEG)
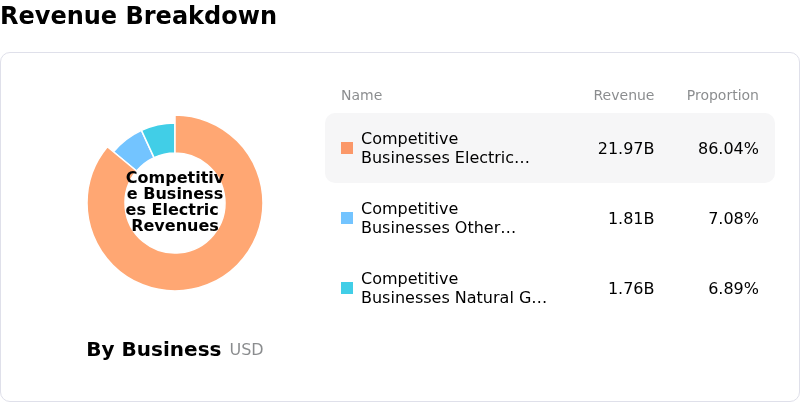
Constellation Energy Corp (CEG) is in the Utilities industry. Its latest annual revenue is $25.53B, ranking 7 in the industry. The net profit is $2.32B, ranking 11 in the industry. Company Profile
Over the past month, multiple analysts have rated the company as Buy, with an average price target of $349.70, a high of $441.00, and a low of $290.00.
More details about Constellation Energy Corp (CEG)
Company Specific Risks:
- GAAP Earnings Contraction and Top-Line Revenue Miss: In its Q2 2026 financial results, Constellation reported total revenue of $7.50 billion, missing analyst consensus expectations of $7.83 billion, while GAAP net income fell sharply year-over-year to $513 million ($1.42 per basic share) from $839 million ($2.67 per basic share) in Q2 2025.
- Surging Debt Burden Post-Calpine Acquisition: Following the integration of Calpine, long-term debt surged to $19.11 billion at the end of Q2 2026, substantially elevating interest expense sensitivity and constraining financial flexibility for capital deployment and share repurchases.
- Regulatory and Capacity Market Delays for Data Center Power Deals: Unresolved FERC proceedings and pending PJM capacity market framework rulings governing behind-the-meter and co-located data center loads present execution risks, threatening to stall or re-rate the economics of hyperscaler contract negotiations.
- Mandated Asset Divestiture Execution Risks: To satisfy federal antitrust regulatory commitments related to the Calpine transaction, Constellation was required to enter an agreement to sell its 606 MW Brazos Valley Energy Center for $860 million, leaving the deal subject to Department of Justice approval and closing risk.
This article may include AI-generated content that is human-reviewed, which is for reference and general information purposes only and does not constitute investment advice.
Recommended Articles








Comments (0)
Click the $ button, enter the symbol, and select to link a stock, ETF, or other ticker.