


Blackstone Inc Stock (BX) Moved Up by 3.50% on Aug 11: What Signal Does It Send?



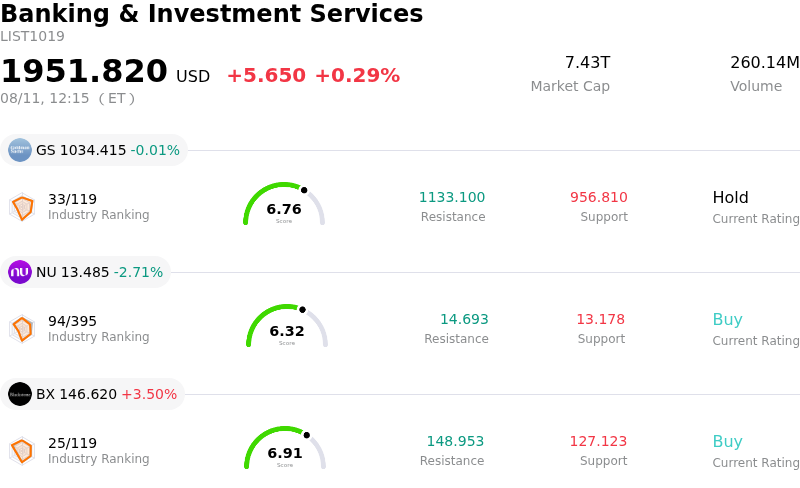
Blackstone Inc (BX) moved up by 3.50%. The Banking & Investment Services sector is up by 0.29%. The company outperformed the industry. Top 3 stocks by turnover in the sector: Goldman Sachs Group Inc (GS) down 0.01%; Nu Holdings Ltd (NU) down 2.71%; Blackstone Inc (BX) up 3.50%.
What is driving Blackstone Inc (BX)’s stock price up today?
Blackstone experienced an upward momentum driven by a combination of robust fundamental performance, post-dividend reinvestment dynamics, and positive institutional sentiment. Following the firm's recent payout of its elevated quarterly dividend, investor confidence remains anchored by a strong quarterly financial report that surpassed market estimates, characterized by solid year-over-year revenue growth. This operational performance underscores the firm's strong management fee generation and expanding fee-earning assets under management, reassuring investors regarding the sustainability of its dividend policy and underlying cash flow generation.
Institutional accumulation and filing updates have provided additional support for the stock. Recent regulatory disclosures highlighted notable stake increases from institutional investment management firms seeking high-conviction exposure to top-tier alternative asset platforms. With institutional investors maintaining a majority stake in the company, sustained buying activity has provided structural price support. Simultaneously, positive analyst sentiment, marked by upward earnings estimate revisions and favorable focus list inclusions, has reinforced market optimism regarding the asset manager's medium-term earnings trajectory.
Strategic growth initiatives within high-secular-growth sectors continue to enhance long-term valuation appeals. Blackstone's focused capital allocation toward digital infrastructure, artificial intelligence power and data infrastructure, energy transition projects, and joint private-market fund solutions positions it well to capture institutional capital flows. Furthermore, as credit market conditions stabilize and deal-making activity recovers across private equity and real estate, the firm's substantial available capital and expansion into perpetual funds reinforce its leadership position in the alternative asset management space.
Technical Analysis of Blackstone Inc (BX)
Technically, Blackstone Inc (BX) shows a MACD (12,26,9) value of 1.804, indicating a buy signal. The RSI at 67.672 suggests neutral condition and the Williams %R at 0.229 suggests overbought condition. Please monitor closely.
Media Coverage of Blackstone Inc (BX)
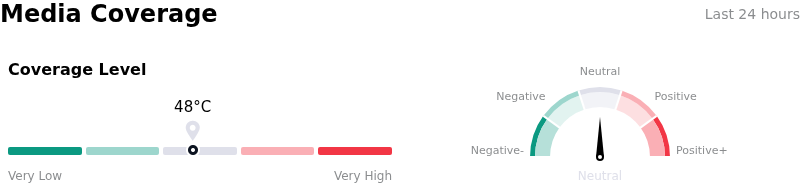
In terms of media coverage, Blackstone Inc (BX) shows a coverage score of 48, indicating a moderate level of media attention. The overall market sentiment index is currently in neutral zone.
Fundamental Analysis of Blackstone Inc (BX)
Blackstone Inc (BX) is in the Banking & Investment Services industry. Its latest annual revenue is $14.87B, ranking 16 in the industry. The net profit is $3.02B, ranking 11 in the industry. Company Profile
Over the past month, multiple analysts have rated the company as Buy, with an average price target of $146.28, a high of $188.00, and a low of $119.00.
More details about Blackstone Inc (BX)
Company Specific Risks:
- Valuation Premium and Intrinsic Overvaluation: Quantitative valuation models indicate BX is trading at roughly an 18% premium to its calculated intrinsic value of $116 per share, carrying a elevated price-to-earnings ratio near 32x relative to the broader capital markets industry median of 19x, leaving limited safety margin for performance deceleration.
- Real Estate Portfolio Quality and Affiliate Drag: Analyst downgrades across affiliated vehicles like Blackstone Mortgage Trust (BXMT)—driven by a 7% book value erosion, high office sector exposure, and potential dividend reductions—underline persistent stress within Blackstone’s key commercial real estate holdings.
- Liquidity Strain and Dividend Payout Coverage: Balance sheet metrics reveal underlying short-term liquidity constraints with a current ratio of 0.72 and quick ratio of 0.76, alongside a dividend payout ratio exceeding 115% that creates financial pressure if asset realizations and exit volumes slow down.
- Insider Liquidation and Fee-Earning Deployment Delays: Recent SEC Form 4 filings show multi-million-dollar share sales by senior executive leadership, compounding institutional concerns regarding a growing lag between uninvested dry powder reserves and fee-earning asset generation.
This article may include AI-generated content that is human-reviewed, which is for reference and general information purposes only and does not constitute investment advice.
Recommended Articles








Comments (0)
Click the $ button, enter the symbol, and select to link a stock, ETF, or other ticker.