


SpaceX Stock (SPCX) Moved Down by 3.14% on Aug 11: Drivers Behind the Movement



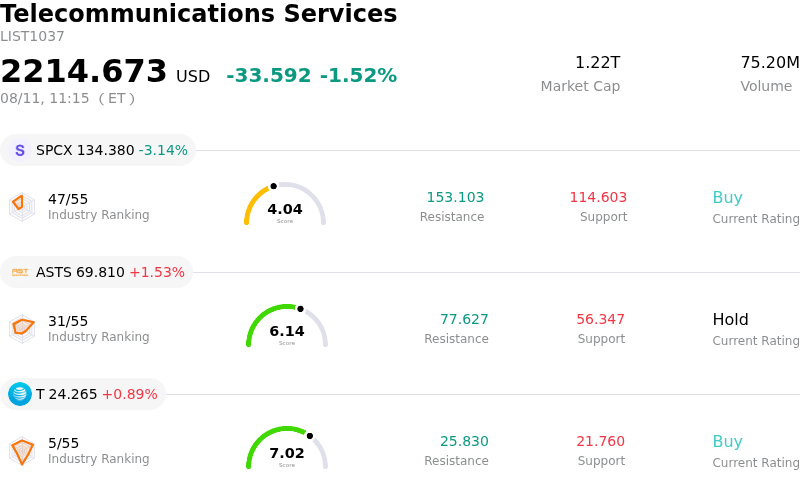
SpaceX (SPCX) moved down by 3.14%. The Telecommunications Services sector is down by 1.52%. The company underperformed the industry. Top 3 stocks by turnover in the sector: SpaceX (SPCX) down 3.14%; AST SpaceMobile Inc (ASTS) up 1.53%; AT&T Inc (T) up 0.85%.
What is driving SpaceX (SPCX)’s stock price down today?
Space Exploration Technologies Corp (SPCX) experienced a downward retracement accompanied by significant intraday volatility as short-term traders locked in profits following the stock's recent multi-day rally. After briefly reclaiming its initial public offering benchmark level in the preceding session, the shares encountered notable technical resistance. The sudden shift in intraday momentum highlights ongoing friction between short-term tactical sellers securing gains from recent lows and long-term buyers attempting to establish a durable price floor.
Fundamental headwinds centered on capital expenditure intensity continue to filter through market sentiment. Following the company's inaugural quarterly financial report as a public entity, investor focus has remained firmly fixed on the substantial capital commitments required to expand artificial intelligence compute capacity and terrestrial infrastructure. Although top-line expansion in core satellite connectivity operations remains strong, the elevated cash burn and persistent operating losses have kept fundamental investors hesitant, preventing a sustained upward breakout in the absence of near-term profitability catalysts.
Valuation dynamics and elevated turnover further amplified intraday price swings. Trading at a steep price-to-sales multiple relative to the broader aerospace and technology sectors, the equity remains acutely sensitive to broader risk-off sentiment across high-beta growth assets. Active retail participation on social media channels combined with rebalancing flows from prominent growth-focused exchange-traded funds created a volatile trading environment, pushing the stock into choppy territory throughout the session.
Looking ahead, market participants are closely monitoring whether key technical support levels near the initial public offering price will hold against ongoing profit-taking. Until the company provides clearer visibility on the timeline for capital expenditure normalization and margin expansion, price action is likely to remain range-bound with elevated volatility driven by headline risk and institutional trading flows.
Technical Analysis of SpaceX (SPCX)
Technically, SpaceX (SPCX) shows a MACD (12,26,9) value of 1.898, indicating a neutral signal. The RSI at 59.156 suggests neutral condition and the Williams %R at 1.510 suggests overbought condition. Please monitor closely.
Fundamental Analysis of SpaceX (SPCX)
SpaceX (SPCX) is in the Telecommunications Services industry. Its latest annual revenue is $18.67B, ranking 10 in the industry. The net profit is $-4.94B, ranking 61 in the industry. Company Profile
Over the past month, multiple analysts have rated the company as Buy, with an average price target of $234.23, a high of $800.00, and a low of $117.00.
More details about SpaceX (SPCX)
Company Specific Risks:
- Extreme Capital Expenditure and Cash Burn: Recent Q2 financial updates reveal quarterly capital expenditures reaching $18.37 billion and negative free cash flow burning $16.8 billion due to aggressive expansion in AI compute and satellite infrastructure, fueling institutional concerns over persistent operational losses.
- Uncertain Financing Mechanics for $60B Acquisition: SEC Form 8-K filings for the agreed $60 billion acquisition of AI coding startup Cursor omit detailed financing structures and closing conditions, creating downside risk regarding potential common shareholder dilution or balance sheet strain.
- Supply Overhang from Lockup Expirations and Retail Selling: Following the expiration of initial post-IPO lockup restrictions on August 6 that unlocked over 900 million shares, market tracking data indicates retail investors turned net sellers for the first time since the listing, increasing short-term selling pressure.
- Elevated Valuation Multiple Amid Negative Margins: Financial analysis highlights that the stock trades at an exorbitant Price-to-Sales multiple exceeding 71x despite negative trailing EPS and a -75.6% free cash flow margin, making the valuation highly vulnerable to negative market sentiment or execution delays.
This article may include AI-generated content that is human-reviewed, which is for reference and general information purposes only and does not constitute investment advice.
Recommended Articles








Comments (0)
Click the $ button, enter the symbol, and select to link a stock, ETF, or other ticker.