


Ge Vernova Inc Stock (GEV) Moved Up by 3.29% on Aug 11: Facts Behind the Movement



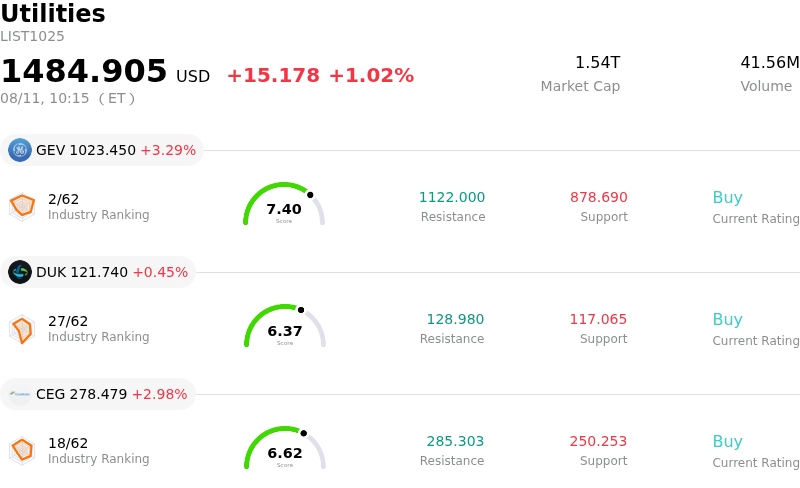
Ge Vernova Inc (GEV) moved up by 3.29%. The Utilities sector is up by 1.02%. The company outperformed the industry. Top 3 stocks by turnover in the sector: Ge Vernova Inc (GEV) up 3.29%; Duke Energy Corp (DUK) up 0.45%; Constellation Energy Corp (CEG) up 2.98%.
What is driving Ge Vernova Inc (GEV)’s stock price up today?
GE Vernova experienced upward movement accompanied by notable intraday volatility as investors weighed long-term growth opportunities against short-term execution challenges. A central catalyst fueling positive investor sentiment is the persistent structural tailwind provided by global power demand, driven aggressively by the expansion of artificial intelligence data centers, electrification of industrial infrastructure, and utility grid modernization. Recent quarterly operational updates highlighted robust order activity across the Power and Electrification segments, pushing total order backlog to record levels and expanding gas equipment slot reservations, giving investors multi-year revenue visibility.
Market confidence has been further reinforced by management raising full-year revenue and free cash flow guidance, supported by disciplined contract pricing and significant share buyback programs that enhance earnings growth potential. Strategic operational moves, such as expanding high-voltage power transmission manufacturing capacity in Pennsylvania to unclog grid bottlenecks and securing major international onshore wind turbine supply contracts, demonstrate strong execution in high-demand markets. Positive analyst coverage and institutional accumulation have provided additional tailwinds, as Wall Street increasingly views energy equipment manufacturers as indispensable beneficiaries of the energy transition.
Despite the broader upward trajectory, the stock experienced intraday fluctuations as market participants evaluated margin headwinds within the wind power business and potential trade policy developments, including global tariffs. Investors continue to scrutinize the timing of revenue conversion from long-duration backlog, balancing immediate profitability considerations against multi-year earnings potential. Nevertheless, strong fundamental positioning across gas turbines and grid infrastructure offset near-term cautious sentiment, driving net buying interest throughout the session.
Technical Analysis of Ge Vernova Inc (GEV)
Technically, Ge Vernova Inc (GEV) shows a MACD (12,26,9) value of -0.211, indicating a sell signal. The RSI at 46.211 suggests neutral condition and the Williams %R at 37.572 suggests buy condition. Please monitor closely.
Media Coverage of Ge Vernova Inc (GEV)
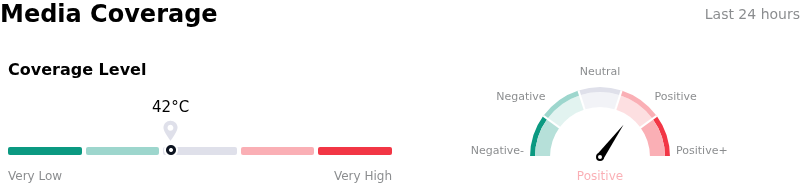
In terms of media coverage, Ge Vernova Inc (GEV) shows a coverage score of 42, indicating a moderate level of media attention. The overall market sentiment index is currently in bullish zone.
Fundamental Analysis of Ge Vernova Inc (GEV)
Ge Vernova Inc (GEV) is in the Utilities industry. Its latest annual revenue is $38.07B, ranking 2 in the industry. The net profit is $4.88B, ranking 4 in the industry. Company Profile
Over the past month, multiple analysts have rated the company as Buy, with an average price target of $1218.98, a high of $1450.00, and a low of $836.00.
More details about Ge Vernova Inc (GEV)
Company Specific Risks:
- Q2 Earnings Miss and Valuation Pressure: GE Vernova reported quarterly EPS of $2.47, missing Wall Street consensus estimates of $3.17 by $0.70 per share, triggering profit-taking and volatility as analysts re-evaluate elevated valuation multiples following the stock's multi-month rally.
- Persistent Losses in Wind Business Segment: The Wind division remains an operational drag, generating $300 million in quarterly EBITDA losses and projecting a $400 million full-year segment loss due to soft Onshore equipment deliveries, higher Offshore project costs, and ongoing claims settlement expenses.
- Supply Chain Disruptions and Tariff Cost Escalation: Ongoing bottlenecks across complex global supply networks, combined with international import tariffs on raw materials and electrical grid components, threaten input costs and operational delivery timelines across Gas Power and Electrification capacity expansion efforts.
- Executive Insider Share Divestments: Recent SEC disclosures revealing significant equity sales by corporate executives, including substantial position reductions by senior leadership, have amplified institutional caution regarding potential peak-cycle risks in power equipment demand.
This article may include AI-generated content that is human-reviewed, which is for reference and general information purposes only and does not constitute investment advice.
Recommended Articles








Comments (0)
Click the $ button, enter the symbol, and select to link a stock, ETF, or other ticker.