


Newmont Corporation Stock (NEM) Moved Up by 3.05% on Aug 10: Key Drivers Unveiled



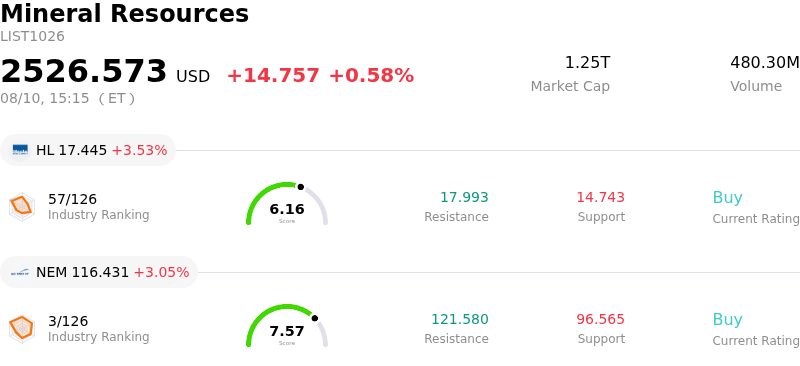
Newmont Corporation (NEM) moved up by 3.05%. The Mineral Resources sector is up by 0.58%. The company outperformed the industry. Top 3 stocks by turnover in the sector: Barrick Mining Ord Shs (B) down 6.71%; Hecla Mining Co (HL) up 3.53%; Newmont Corporation (NEM) up 3.05%.
What is driving Newmont Corporation (NEM)’s stock price up today?
Newmont Corporation's upward trajectory today is primarily driven by a broader rally in the precious metals sector, underpinned by shifting macroeconomic expectations and a softening of the U.S. dollar. As the world’s largest gold producer, Newmont maintains a high beta relative to spot gold prices, making it a primary vehicle for institutional investors looking to hedge against renewed inflationary pressures or geopolitical instability. The current market environment appears to be pricing in a more accommodative stance from the Federal Reserve, which lowers the opportunity cost of holding non-yielding assets like gold and directly benefits the valuation of major miners.
From an operational perspective, investor sentiment has been bolstered by the company's recent progress in its portfolio optimization strategy. Following its large-scale acquisition activity in previous periods, Newmont has been focused on divesting non-core assets to streamline its operations and strengthen its balance sheet. The market is reacting positively to indications that these divestitures are fetching higher than expected valuations, providing the company with significant liquidity to fund its capital expenditure programs at its core Tier 1 mines. This focus on high-margin, long-life assets is crucial for maintaining a competitive All-In Sustaining Cost profile amidst global inflationary pressures on labor and energy.
Furthermore, the latest industry-wide data suggests a tightening of global gold supply, which provides a structural tailwind for Newmont. As the company continues to integrate its expanded asset base, synergies are beginning to materialize more clearly in its financial reporting. Analysts have noted that the stabilization of production levels at key sites in Nevada and Australia has reduced the operational risk premium that previously weighed on the stock. This improvement in execution, combined with a disciplined approach to shareholder returns through dividends and share buybacks, has encouraged a rotation back into the mining sector.
Institutional positioning also plays a role in today’s movement. As portfolio managers rebalance their exposures toward defensive equities in anticipation of heightened market volatility, Newmont stands out as a liquidity-rich option with a solid ESG profile. The convergence of favorable technical indicators and improving fundamental outlooks has triggered a wave of buy-side activity. Moving forward, the stock’s performance will likely remain tethered to real interest rate trends and the company’s ability to maintain its production guidance while managing the complexities of its global supply chain.
Technical Analysis of Newmont Corporation (NEM)
Technically, Newmont Corporation (NEM) shows a MACD (12,26,9) value of 4.610, indicating a neutral signal. The RSI at 72.275 suggests buy condition and the Williams %R at 3.167 suggests overbought condition. Please monitor closely.
Media Coverage of Newmont Corporation (NEM)
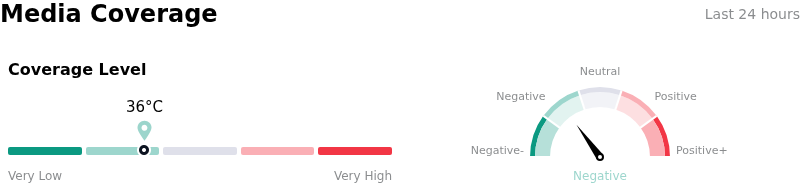
In terms of media coverage, Newmont Corporation (NEM) shows a coverage score of 36, indicating a low level of media attention. The overall market sentiment index is currently in bearish zone.
Fundamental Analysis of Newmont Corporation (NEM)
Newmont Corporation (NEM) is in the Mineral Resources industry. Its latest annual revenue is $22.67B, ranking 8 in the industry. The net profit is $7.08B, ranking 3 in the industry. Company Profile
Over the past month, multiple analysts have rated the company as Buy, with an average price target of $131.73, a high of $205.00, and a low of $64.32.
More details about Newmont Corporation (NEM)
Company Specific Risks:
- Elevated All-In Sustaining Costs (AISC): Recent financial disclosures confirmed that AISC has surged to approximately $1,611 per ounce, significantly exceeding consensus estimates of $1,450-$1,500 and signaling severe margin compression despite high spot gold prices.
- Operational Underperformance at Tier 1 Assets: Technical disruptions and lower-than-expected ore grades at the Brucejack and Tanami operations have resulted in production volumes falling short of institutional targets, leading to downward revisions in analyst production forecasts.
- Negative Free Cash Flow Pressure: Management's guidance for increased capital expenditures and heavy reinvestment requirements for its legacy portfolio has sparked concerns regarding the company's ability to generate sufficient free cash flow to support its dividend and share buyback programs.
- Execution Risk in Asset Divestitures: Ongoing uncertainty regarding the timing and valuation of the $2 billion non-core asset sale program creates a significant overhang on the stock, as any failure to secure premium prices for these assets would delay the company's deleveraging objectives.
This article may include AI-generated content that is human-reviewed, which is for reference and general information purposes only and does not constitute investment advice.
Recommended Articles








Comments (0)
Click the $ button, enter the symbol, and select to link a stock, ETF, or other ticker.