


Newmont Corporation Stock (NEM) Moved Up by 5.79% on Aug 7: Facts Behind the Movement



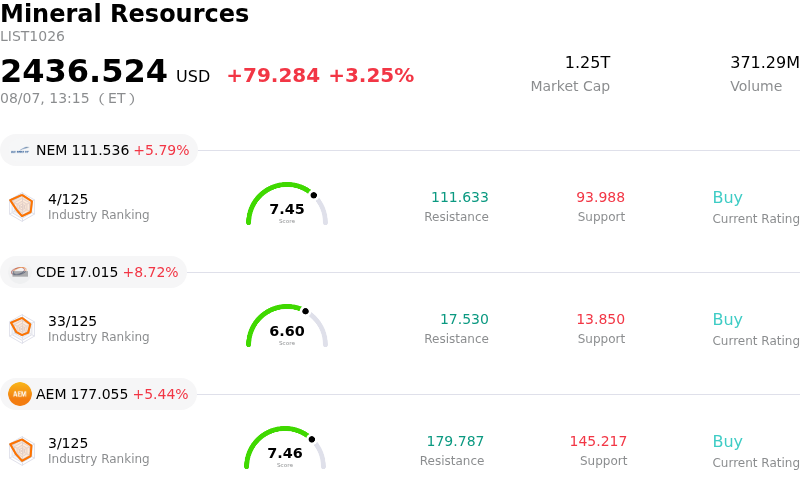
Newmont Corporation (NEM) moved up by 5.79%. The Mineral Resources sector is up by 3.25%. The company outperformed the industry. Top 3 stocks by turnover in the sector: Newmont Corporation (NEM) up 5.79%; Coeur Mining Inc (CDE) up 8.92%; Agnico Eagle Mines Ltd (AEM) up 5.44%.
What is driving Newmont Corporation (NEM)’s stock price up today?
The recent upward trajectory in Newmont's shares is primarily anchored by a significant rally in global gold prices, which serves as the fundamental driver for the company's valuation. Macroeconomic indicators released today, particularly those suggesting a cooling labor market or shifting inflationary pressures, have heightened market expectations for a more accommodative monetary policy from the Federal Reserve. As real interest rates decline and the U.S. dollar softens, gold has emerged as a preferred safe-haven asset, significantly enhancing the revenue potential for the world’s largest gold producer.
Internal strategic developments are also providing a substantial tailwind. Newmont has made notable progress in its post-merger integration and non-core asset divestiture program. By focusing on high-grade, low-cost Tier 1 assets, the company is successfully optimizing its portfolio to improve all-in sustaining costs and maximize free cash flow. This disciplined approach to capital allocation, coupled with a commitment to returning value to shareholders through dividends and buybacks, has reinforced institutional confidence in the firm’s long-term margin stability.
From a market sentiment perspective, a wave of positive analyst revisions has contributed to the intraday momentum. Several prominent research firms have upgraded their outlook on the mining sector, specifically highlighting Newmont’s superior scale and operational resilience compared to its peers. The resulting surge in buying activity has been amplified by institutional portfolio rebalancing and momentum-driven trading as the stock clears major technical resistance levels. This indicates a broader consensus that the company is well-positioned to capitalize on a sustained bull cycle in the precious metals market.
While the current performance is robust, investors remain mindful of potential risks such as unexpected shifts in geopolitical tensions or sudden hawkish pivots in central bank rhetoric. However, the confluence of favorable macro conditions, improved operational efficiency, and bullish technical indicators suggests that the positive sentiment is backed by solid fundamentals. Newmont’s ability to maintain production targets while navigating currency fluctuations remains a critical factor for maintaining this upward momentum in the short term.
Technical Analysis of Newmont Corporation (NEM)
Technically, Newmont Corporation (NEM) shows a MACD (12,26,9) value of 3.388, indicating a neutral signal. The RSI at 65.104 suggests neutral condition and the Williams %R at 5.541 suggests overbought condition. Please monitor closely.
Media Coverage of Newmont Corporation (NEM)
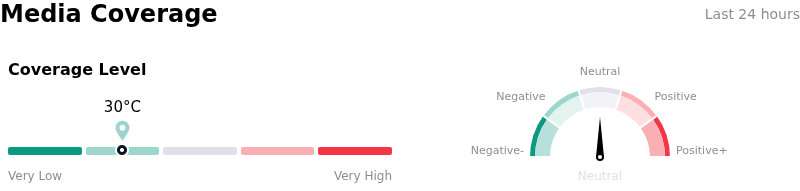
In terms of media coverage, Newmont Corporation (NEM) shows a coverage score of 30, indicating a low level of media attention. The overall market sentiment index is currently in neutral zone.
Fundamental Analysis of Newmont Corporation (NEM)
Newmont Corporation (NEM) is in the Mineral Resources industry. Its latest annual revenue is $22.67B, ranking 8 in the industry. The net profit is $7.08B, ranking 3 in the industry. Company Profile
Over the past month, multiple analysts have rated the company as Buy, with an average price target of $130.81, a high of $205.00, and a low of $64.32.
More details about Newmont Corporation (NEM)
Company Specific Risks:
- Escalating Operating Costs: Recent Q3 2024 earnings data revealed that "Costs Applicable to Sales" (CAS) surged to $1,207 per ounce, significantly exceeding analyst consensus and indicating that internal inflationary pressures are neutralizing the profit tailwinds from record-high gold prices.
- Capital Expenditure Overruns: Management has signaled increased spending requirements for the Tanami Expansion 2 and Lihir projects, raising immediate concerns regarding budget discipline and the potential for further downward revisions to free cash flow guidance in the coming fiscal year.
- Operational Underperformance at Tier 1 Assets: Lower-than-anticipated production volumes at the Brucejack and Lihir mines, largely due to geotechnical challenges and maintenance delays, have undermined investor confidence in the successful integration and synergy realization of the Newcrest acquisition.
- Institutional Rating Downgrades: Following the earnings miss and margin compression, multiple brokerages have slashed price targets and downgraded the stock, citing a structural inability to convert high realized gold prices into meaningful shareholder yield compared to industry peers.
This article may include AI-generated content that is human-reviewed, which is for reference and general information purposes only and does not constitute investment advice.
Recommended Articles







Comments (0)
Click the $ button, enter the symbol, and select to link a stock, ETF, or other ticker.