


Ethereum (ETHUSD) Is down 1.41% on Aug 3: What Do On-Chain Data and Market Sentiment Show?



Ethereum (ETHUSD) is down 1.41% at Aug 3 00:00(ET), now at $1854.68, with a 7-day down of 4.61%.
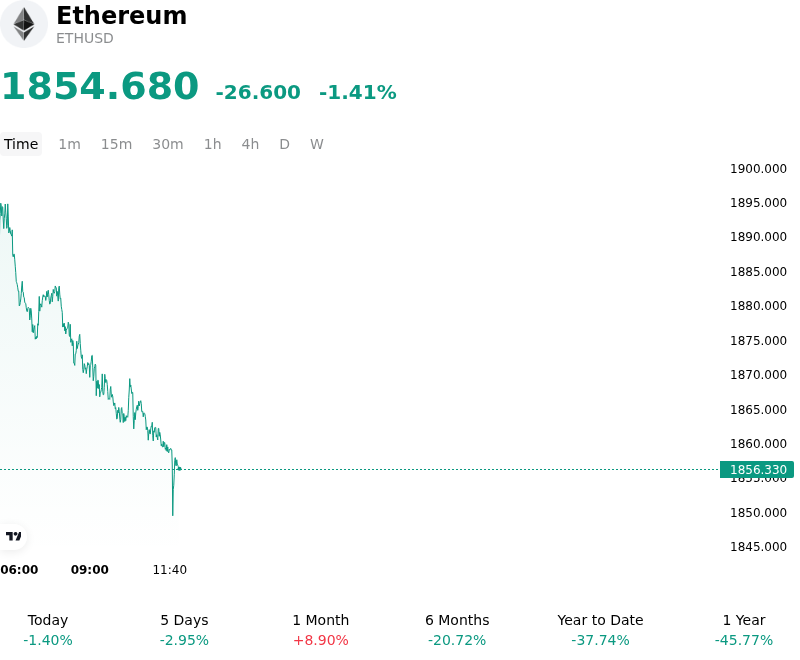
What is driving Ethereum (ETHUSD)’s stock price down today?
The current downward pressure on Ethereum reflects a tightening of global liquidity conditions and a shift in institutional risk appetite following recent U.S. macroeconomic data. As the market recalibrates its expectations for Federal Reserve policy through the second half of 2026, an uptick in Treasury yields and a strengthening U.S. Dollar have created a challenging environment for non-yielding and high-beta digital assets. This macro-driven risk aversion has prompted institutional allocators to de-risk portfolios, leading to a noticeable reduction in capital inflows to spot Ethereum ETFs.
The intraday volatility is largely attributed to a pivot in institutional sentiment, evidenced by a reversal in net ETF flows. After a period of sustained accumulation, professional investors appear to be trimming exposure in response to broader market uncertainty. This selling pressure has been exacerbated by a slowdown in network staking activity, as the narrowing spread between Ethereum’s staking yield and risk-free rates in the traditional fixed-income market reduces the relative attractiveness of on-chain yield capture. Consequently, the premium that Ethereum typically commands during periods of expansionary liquidity is currently being challenged.
On-chain data indicates an increase in exchange-inbound transfers, suggesting that large-scale holders are positioning for liquidity rather than long-term accumulation. This shift in positioning triggered a cascade of long liquidations within the derivatives market, specifically targeting leveraged perpetual swap positions. As these positions were forced closed, the resulting sell-side pressure encountered thin liquidity, magnifying the downward move. This deleveraging event highlights the current sensitivity of the market to institutional capital rotations and the lack of immediate retail-driven support to absorb large-block transactions.
Furthermore, structural shifts within the Ethereum ecosystem are contributing to the cautious outlook. The continued migration of transaction volume to Layer-2 scaling solutions has altered the traditional relationship between network activity and the base layer’s fee-burning mechanism. While this transition is beneficial for long-term scalability, the short-term impact on the supply-demand equilibrium of the asset remains a point of contention for valuation models used by institutional researchers. Investors are also closely monitoring potential regulatory adjustments concerning decentralized finance protocols, which adds a layer of jurisdictional risk to the current market environment.
Despite the recent pullback, the move is currently viewed as a liquidity-driven correction within a broader structural trend. Institutional participants remain focused on the long-term integration of Ethereum into global financial infrastructure, particularly regarding tokenization and institutional-grade DeFi. However, until macro liquidity conditions stabilize or a clear catalyst emerges from upcoming network upgrades, Ethereum remains susceptible to the prevailing risk-off sentiment dominating the global macro landscape. Market participants continue to monitor the interplay between ETF flows and Treasury yields as the primary indicators for a potential trend reversal.
Technical Analysis of Ethereum (ETHUSD)
Technically, Ethereum (ETHUSD) shows a MACD (12,26,9) value of -19.976, indicating a neutral signal. The RSI at 50.311 suggests neutral condition and the Williams %R at 76.310 suggests sell condition. Please monitor closely.
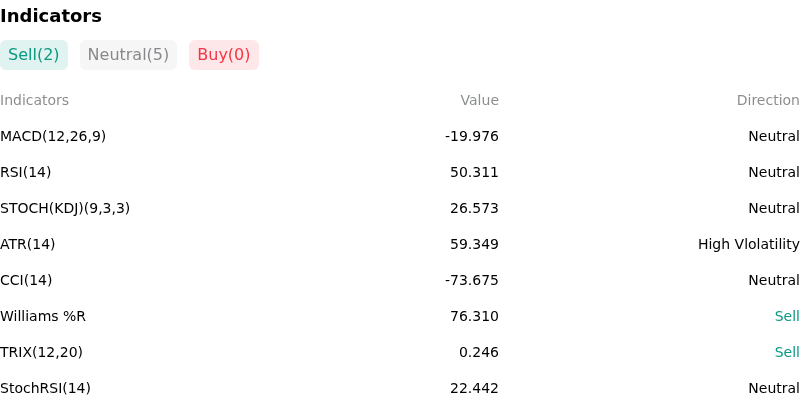
More details about Ethereum (ETHUSD)
Recent Events and Risks:
- Institutional ETF Outflows: Spot Ether ETFs have experienced a period of net negative flows over the last 48 hours, as persistent liquidations from high-fee products like the Grayscale Ethereum Trust (ETHE) continue to outweigh the stagnating inflows into competing investment vehicles, creating a supply-demand imbalance.
- ETH/BTC Ratio Technical Breakdown: The Ethereum-to-Bitcoin price ratio has recently touched multi-year lows, dropping below critical psychological support levels; this indicates a structural shift in market preference toward Bitcoin and triggers automated sell programs for traders monitoring cross-asset relative strength.
- Whale and Foundation Liquidity Influx: On-chain data has identified significant transfers of ETH from the Ethereum Foundation and large "whale" wallets to centralized exchanges within the last 72 hours, raising concerns among market participants of impending large-scale spot selling.
- Network Revenue and Burn Rate Decline: A decrease in Layer 1 transaction activity and the continued migration of volume to Layer 2 scaling solutions have led to a sharp reduction in gas fees, causing the ETH burn rate to fall below the issuance rate and reintroducing inflationary pressure on the total supply.
This article may include AI-generated content that is human-reviewed, which is for reference and general information purposes only and does not constitute investment advice.
Recommended Articles









Comments (0)
Click the $ button, enter the symbol, and select to link a stock, ETF, or other ticker.