

Cboe Global Markets Inc Stock (CBOE) Moved Down by 7.05% on Jun 16: What Investors Need To Know

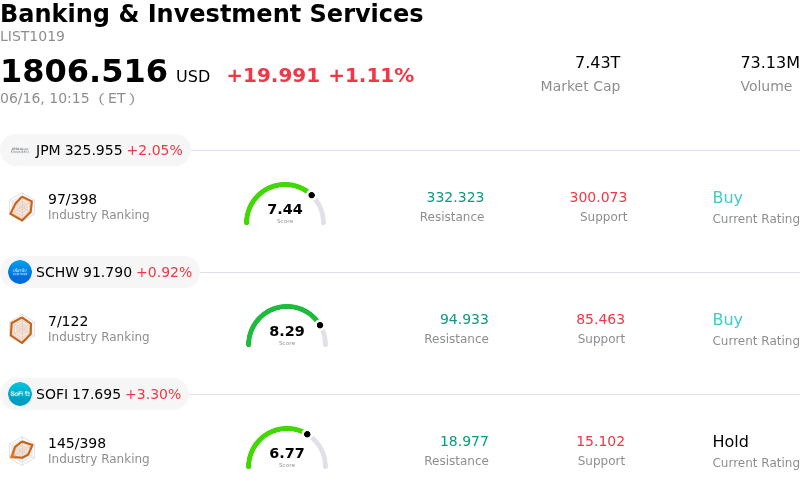
Cboe Global Markets Inc (CBOE) moved down by 7.05%. The Banking & Investment Services sector is up by 1.11%. The company underperformed the industry. Top 3 stocks by turnover in the sector: JPMorgan Chase & Co (JPM) up 1.93%; Charles Schwab Corp (SCHW) up 0.92%; SoFi Technologies Inc (SOFI) up 3.33%.
What is driving Cboe Global Markets Inc (CBOE)’s stock price down today?
The primary catalyst driving the downward pressure on Cboe Global Markets is the rapid normalization of global risk sentiment and a subsequent decline in market volatility. The tentative peace agreement reached between the United States and Iran has significantly eased geopolitical anxiety, sending crude oil prices lower and fueling a strong risk-on rally across broader equity markets. Consequently, the Cboe Volatility Index (VIX), which serves as the market’s primary gauge of investor fear, experienced a sharp contraction. Because the company's transaction-heavy business model is highly sensitive to market-wide volatility, which stimulates demand for its proprietary S&P 500 index options and volatility-linked derivatives, a calming market directly dampens the near-term outlook for its core trading volume and transaction-based revenues.
As investors shift their focus to the Federal Reserve’s June policy meeting, the transition toward a more stable macroeconomic environment has further suppressed the hedging demand that typically bolsters exchange operators. The dramatic run-up in trading volumes that the firm enjoyed earlier in the year, fueled by zero-day-to-expiry options and systemic hedging during heightened global tensions, faces a period of deceleration as geopolitical risks subside. While the company continues to expand its technological capabilities and prepare for extended trading hours for select equity options, these long-term growth initiatives are temporarily overshadowed by immediate headwinds of declining implied volatility and a cooling derivatives environment.
In addition to shifting macro dynamics, the recent trading behavior reflects a broader technical pullback from historical highs. Earlier valuation metrics pointed to stretched multiples, raising concerns over whether the market had fully priced in future expansion. With risk sentiment shifting toward high-growth equities and landmark market events like the SpaceX public debut drawing significant capital and speculative retail activity, market participants appear to be taking profits in defensive financial infrastructure names. This rotation out of exchange-operator stocks in favor of riskier, momentum-driven technology assets has compounded the downward momentum for the company.
Technical Analysis of Cboe Global Markets Inc (CBOE)
Technically, Cboe Global Markets Inc (CBOE) shows a MACD (12,26,9) value of -5.691, indicating a sell signal. The RSI at 39.516 suggests neutral condition and the Williams %R at 73.326 suggests sell condition. Please monitor closely.
Media Coverage of Cboe Global Markets Inc (CBOE)
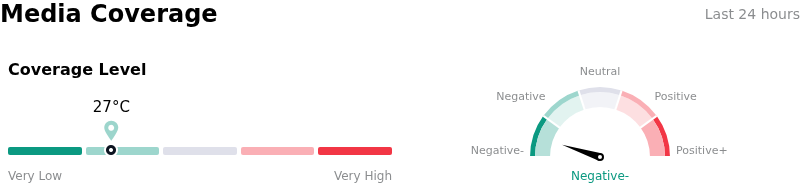
In terms of media coverage, Cboe Global Markets Inc (CBOE) shows a coverage score of 27, indicating a low level of media attention. The overall market sentiment index is currently in extremely bearish zone.
Fundamental Analysis of Cboe Global Markets Inc (CBOE)
Cboe Global Markets Inc (CBOE) is in the Banking & Investment Services industry. Its latest annual revenue is $2.69B, ranking 44 in the industry. The net profit is $1.09B, ranking 22 in the industry. Company Profile
Over the past month, multiple analysts have rated the company as Hold, with an average price target of $328.77, a high of $382.00, and a low of $273.00.
More details about Cboe Global Markets Inc (CBOE)
Company Specific Risks:
- **Sustained Technical Breakdown and Bearish Momentum**: CBOE is experiencing heightened intraday volatility and a severe downward bias, trading well below its 20-day moving average of $321.74 and 50-day moving average of $318.14. Bearish technical indicators, including a negative MACD and weak RSI, show sellers maintain short-term control as the stock continues to pull back from recent highs to test critical support near $273.88.
- **Intense Fee Competition and Market Share Erosion**: Despite elevated market volumes, Cboe continues to face heavy pricing and rebate competition in multi-listed options and U.S. equities. Recent performance data indicates Cboe’s options exchange market share has slipped to 29.1% (down from 31.1% year-over-year), while its U.S. equities exchange market share declined to 9.8%. This competitive pressure is expected to escalate with the high-profile launch of SpaceX equity options across multiple rival exchanges on June 16, 2026.
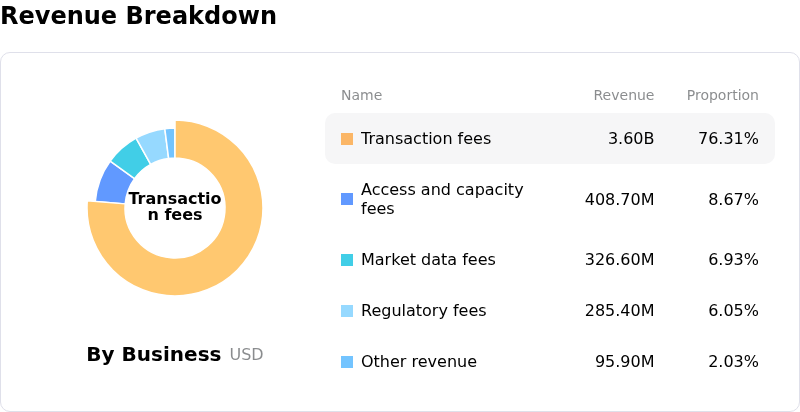
- **Extreme Revenue Concentration in Flagship Index Complexes**: The business model is highly concentrated on proprietary SPX and VIX index products. This heavy reliance on zero-days-to-expiration (0DTE) contracts leaves Cboe structurally vulnerable to any sudden deceleration in retail option volumes, or a broad normalization of geopolitical and interest-rate-driven macroeconomic volatility.
- **Organizational Disruption from Realignment and Downsizing**: Cboe is managing significant internal execution risks stemming from an aggressive strategic restructuring, which includes a 20% workforce reduction, a mandatory return-to-office transition, and the complete wind-down of the Cboe Europe Derivatives (CEDX) platform. These severe operational changes, alongside planned divestitures of international units, threaten near-term productivity and may result in temporary revenue contraction.
This article may include AI-generated content that is human-reviewed, which is for reference and general information purposes only and does not constitute investment advice.
Recommended Articles


Comments (0)
Click the $ button, enter the symbol, and select to link a stock, ETF, or other ticker.