

Goldman Sachs Group Inc Stock (GS) Closed Down by 3.04% on Jun 10: What Signal Does It Send?

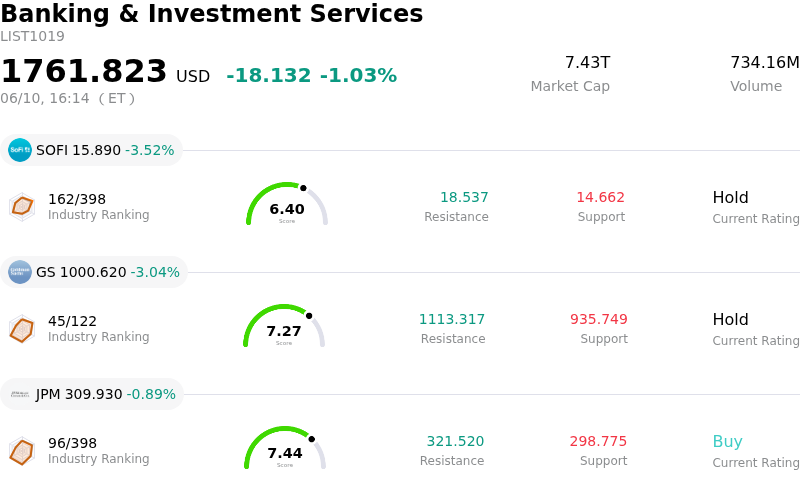
Goldman Sachs Group Inc (GS) closed down by 3.04%. The Banking & Investment Services sector is down by 1.03%. The company underperformed the industry. Top 3 stocks by turnover in the sector: SoFi Technologies Inc (SOFI) down 3.52%; Goldman Sachs Group Inc (GS) down 3.04%; JPMorgan Chase & Co (JPM) down 0.89%.
What is driving Goldman Sachs Group Inc (GS)’s stock price down today?
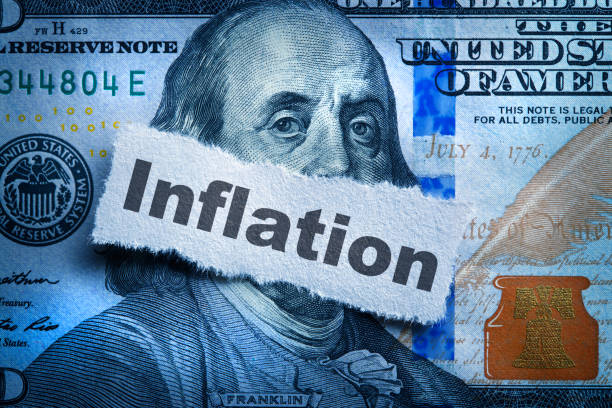
Goldman Sachs (GS) experienced a notable decline, driven by a confluence of macroeconomic factors and shifting market sentiment on the day. Key among these was the release of May's Consumer Price Index (CPI) data, which, despite a slightly cooler core inflation reading, presented an elevated headline figure, reinforcing expectations that the Federal Reserve may maintain higher interest rates for an extended period. This "higher for longer" interest rate outlook typically dampens the broader market, particularly impacting the financial sector's deal-making and financing activities.
Further exacerbating this sentiment, Goldman Sachs itself revised its forecast for Federal Reserve interest rate cuts, now anticipating no cuts in 2026 and pushing the first potential cut into 2027. This change in outlook, attributed to stronger-than-expected labor market data, signals a less favorable environment for investment banking and related operations, which are crucial revenue streams for the firm.
Broader market volatility also played a significant role, with equities experiencing pronounced swings throughout the trading session. Geopolitical tensions, rising energy prices, and concerns regarding AI-driven market exuberance contributed to a risk-off mood among investors. Goldman Sachs had also recently issued its own cautionary commentary on potential speculation in AI-related assets, which may have amplified concerns across the financial sector. Additionally, reports emerged that some institutional investors had reduced their holdings in Goldman Sachs during the preceding quarter, which, while historical, could have contributed to negative intraday sentiment upon public disclosure.
Technical Analysis of Goldman Sachs Group Inc (GS)
Technically, Goldman Sachs Group Inc (GS) shows a MACD (12,26,9) value of [31.69], indicating a buy signal. The RSI at 58.04 suggests neutral condition and the Williams %R at -42.03 suggests oversold condition. Please monitor closely.
Media Coverage of Goldman Sachs Group Inc (GS)
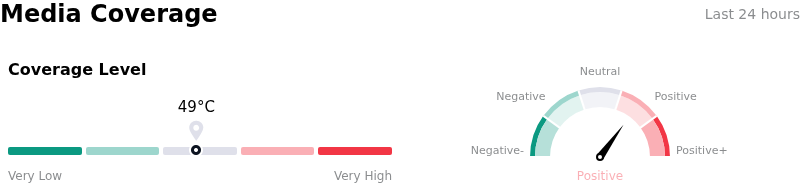
In terms of media coverage, Goldman Sachs Group Inc (GS) shows a coverage score of 49, indicating a moderate level of media attention. The overall market sentiment index is currently in bullish zone.
Fundamental Analysis of Goldman Sachs Group Inc (GS)
Goldman Sachs Group Inc (GS) is in the Banking & Investment Services industry. Its latest annual revenue is $117.10B, ranking 2 in the industry. The net profit is $16.30B, ranking 1 in the industry. Company Profile
Over the past month, multiple analysts have rated the company as Hold, with an average price target of $963.47, a high of $1050.00, and a low of $765.00.
More details about Goldman Sachs Group Inc (GS)
Company Specific Risks:
- Ongoing scrutiny and internal dissent regarding CEO David Solomon's decision to retain former Chief Legal Officer Kathryn Ruemmler as an advisor, despite her controversial ties to Jeffrey Epstein, pose a significant reputational and governance risk to the firm.
- A notable portion of institutional analysts maintain a "Hold" rating for Goldman Sachs stock, with the average 12-month price target suggesting a potential downside of 5% to 8% from current levels, indicating concerns about valuation and future stock performance.
- CEO David Solomon's public commentary warning of "more greed than fear" in the market indicates internal apprehension regarding potential broad market corrections, which could negatively impact Goldman Sachs' market-sensitive trading and investment banking operations.
This article may include AI-generated content that is human-reviewed, which is for reference and general information purposes only and does not constitute investment advice.
Recommended Articles


Comments (0)
Click the $ button, enter the symbol, and select to link a stock, ETF, or other ticker.