


Tesla Q2 Beat Revenue But EPS Miss 35%: Free Cash Flow Collapses -$1.09B as Capex Doubles



AI Podcast


Tesla reported record Q2 2026 revenue of $28.24 billion, up 26% year-on-year, driven by record deliveries of 480,126 units. Despite top-line growth, profitability compressed significantly due to surging operating expenses and soaring capital expenditures. Adjusted EPS missed estimates at $0.33, and free cash flow turned negative to -$1.09 billion. Management projects full-year capex to exceed $25 billion to fund aggressive investments in Cybercab, AI infrastructure, robotics, and chip fabrication. While long-term strategic initiatives advance, soaring spending severely pressures near-term margins and cash flow, testing investor confidence as the stock attempts to recover from its July lows.

TradingKey - Tesla (TSLA) reported a record second quarter of $28.24 billion, up 26% year-on-year and beating analyst expectations by 10.5%. Tesla delivered its first 480,126 record units, up 25% from the previous year. The stock sold off despite the numbers. Guidance fell short of analyst estimates, adjusted EPS coming in at $0.33, compared with analyst estimates at $0.51, which represented a 35% miss. Free cash flow went from positive $1.44 billion a quarter ago to a negative $1.09 billion. Shipment volumes hitting records is not translating to profits.
Expenses grew 47% and capex more than doubled to $5.79 billion. Tesla issued a warning saying full year 2026 capex is expected to hit $25 billion. This is a significant jump compared with the previous year.
Management also mentioned spending $25 billion to develop Cybercab, AI, chip fabrication, and other robot taxis and humanoid robots. Tesla is currently recovering from the crash on July 23rd (when the stock fell 14.5% to $320). The stock currently is trading in the $338-376 range. The Jackson Hole speech by the Federal Reserve Banker on the 27–29 of August will provide the next indication of how comfortable the market is with Tesla’s spending compared to other AI infrastructure companies.
Q2 Revenue $28.24B Beat, But Operating Margin Compressed to 1.4%
Profitability took a severe beating. Operating income plunged by 57% year over year and only amounted to $398 million, bringing the operating margin to 1.4% material vs last years’ 4.1%. GAAP net income declined by 5% to $1.11 billion. The company reached a new milestone by reporting TTM (trailing twelve months) revenue that surpassed $100 billion for the first time, but the profit pool continued to decrease.
EPS Miss: $0.33 vs $0.51 Expected (35% Miss)
Non-GAAP earnings per share were $0.33 and significantly lower than the anticipated $0.51 for a 35% miss. This was primarily the cause for the 14.5% stock drop on July 23. Even after adjusting for other one-time items (warranty true-up, previously offsetting tariffs, lower prices for energy storage), the earnings shortfall was still very much present.
Free Cash Flow Swung Negative: -$1.09B vs +$1.44B Q1
For long-term holders, free cash flow plummeting to the negative amount of $1.09 billion is extremely concerning. Negative cash flow occurred as a result of a $2.53 billion swing in Q1 free cash flow of $1.44 billion. Fortunately, operating cash flow was positive at $4.70 billion in Q2, representing a substantial increase of 85% compared to last year. Unfortunately, capital expenditures increased by 142% of last year's spend at the level of $5.79 billion in Q2. This single quarter capex represented a 20% burn on revenue and was well beyond what a mature automotive company has ever done.
Capex Doubled: $5.79B in Q2 Alone, $25B+ Full-Year Expected
Tesla has multiple fronts of spending on automation and beyond. These include the Cybertruck, new manufacturing for batteries and vehicles, the expansion of Optimus humanoid robots, the infrastructure for AI and computing, and the development of a new chip.
Full year capex will probably exceed $25 billion, as management disclosed. At this expected level, it will be roughly 25% of the TTM revenue, a record level for the company. There is an expectation that this will continue for 2-3 years.
Automotive Gross Margin Pressured: 16.3% ex-Credits (Regulatory Credits Collapsed)
The gross margin for automotive was 16.9%, down from 17.2% last year. Excluding regulatory credits, this margin was 16.3%. Reasons for lower margin include selling at reduced prices (Tesla launched more affordable variants of Model 3, and stopped selling Model S and X), lower regulatory credit income (this almost vanished in Q2), and the burden of commodity costs and tariffs.
Operating Expenses Surged 47% to $4.35B
With new spending on AI infrastructure as well as increased spending on research and development for both autonomous driving and robotics, as well as new stock-based compensation, operating expenses for the period increased by $1.4 billion, up 47%. On the earnings call, management indicated operating expenses would continue to grow beyond and throughout 2026, breaking previous company records.
Cybercab Production Began; Robotaxi Operating in 7 Cities
The Cybercab, or robotaxi, production began in July and August, while the company began providing its robotaxi service in seven metropolitan areas. The number of active subscriptions for the company’s Full Self-Driving (FSD) technology expanded by 56%, reaching a total of 1.48 million. More than 55% of new deliveries in the region included a subscription to the FSD technology.
Optimus Humanoid Production Ramping; Chip Fab Development
Limited production of Optimus, the first generation of the humanoid robotseries, is set to begin very soon on the production line. The first optimuses will be manufactured to collect training data for use in developing the technology, not for customer release. Management noted that Optimus is the most difficult product to scale, involving roughly 10,000 distinct parts.
The company announced the development of an AI chip fab, completing equipment purchases for a “development fab.” Musk would not provide further details, citing how risky and rewarding he expected this venture to be.
Technical Setup: $338 Hold Validates Recovery, $376 Breakout Targets $390+
Taking a look at the daily chart, TSLA crashed from its July 22 close of $374.05 to a daily low of $320 on July 23 ($374.05 - $320 = $54.05 or -14.5%).
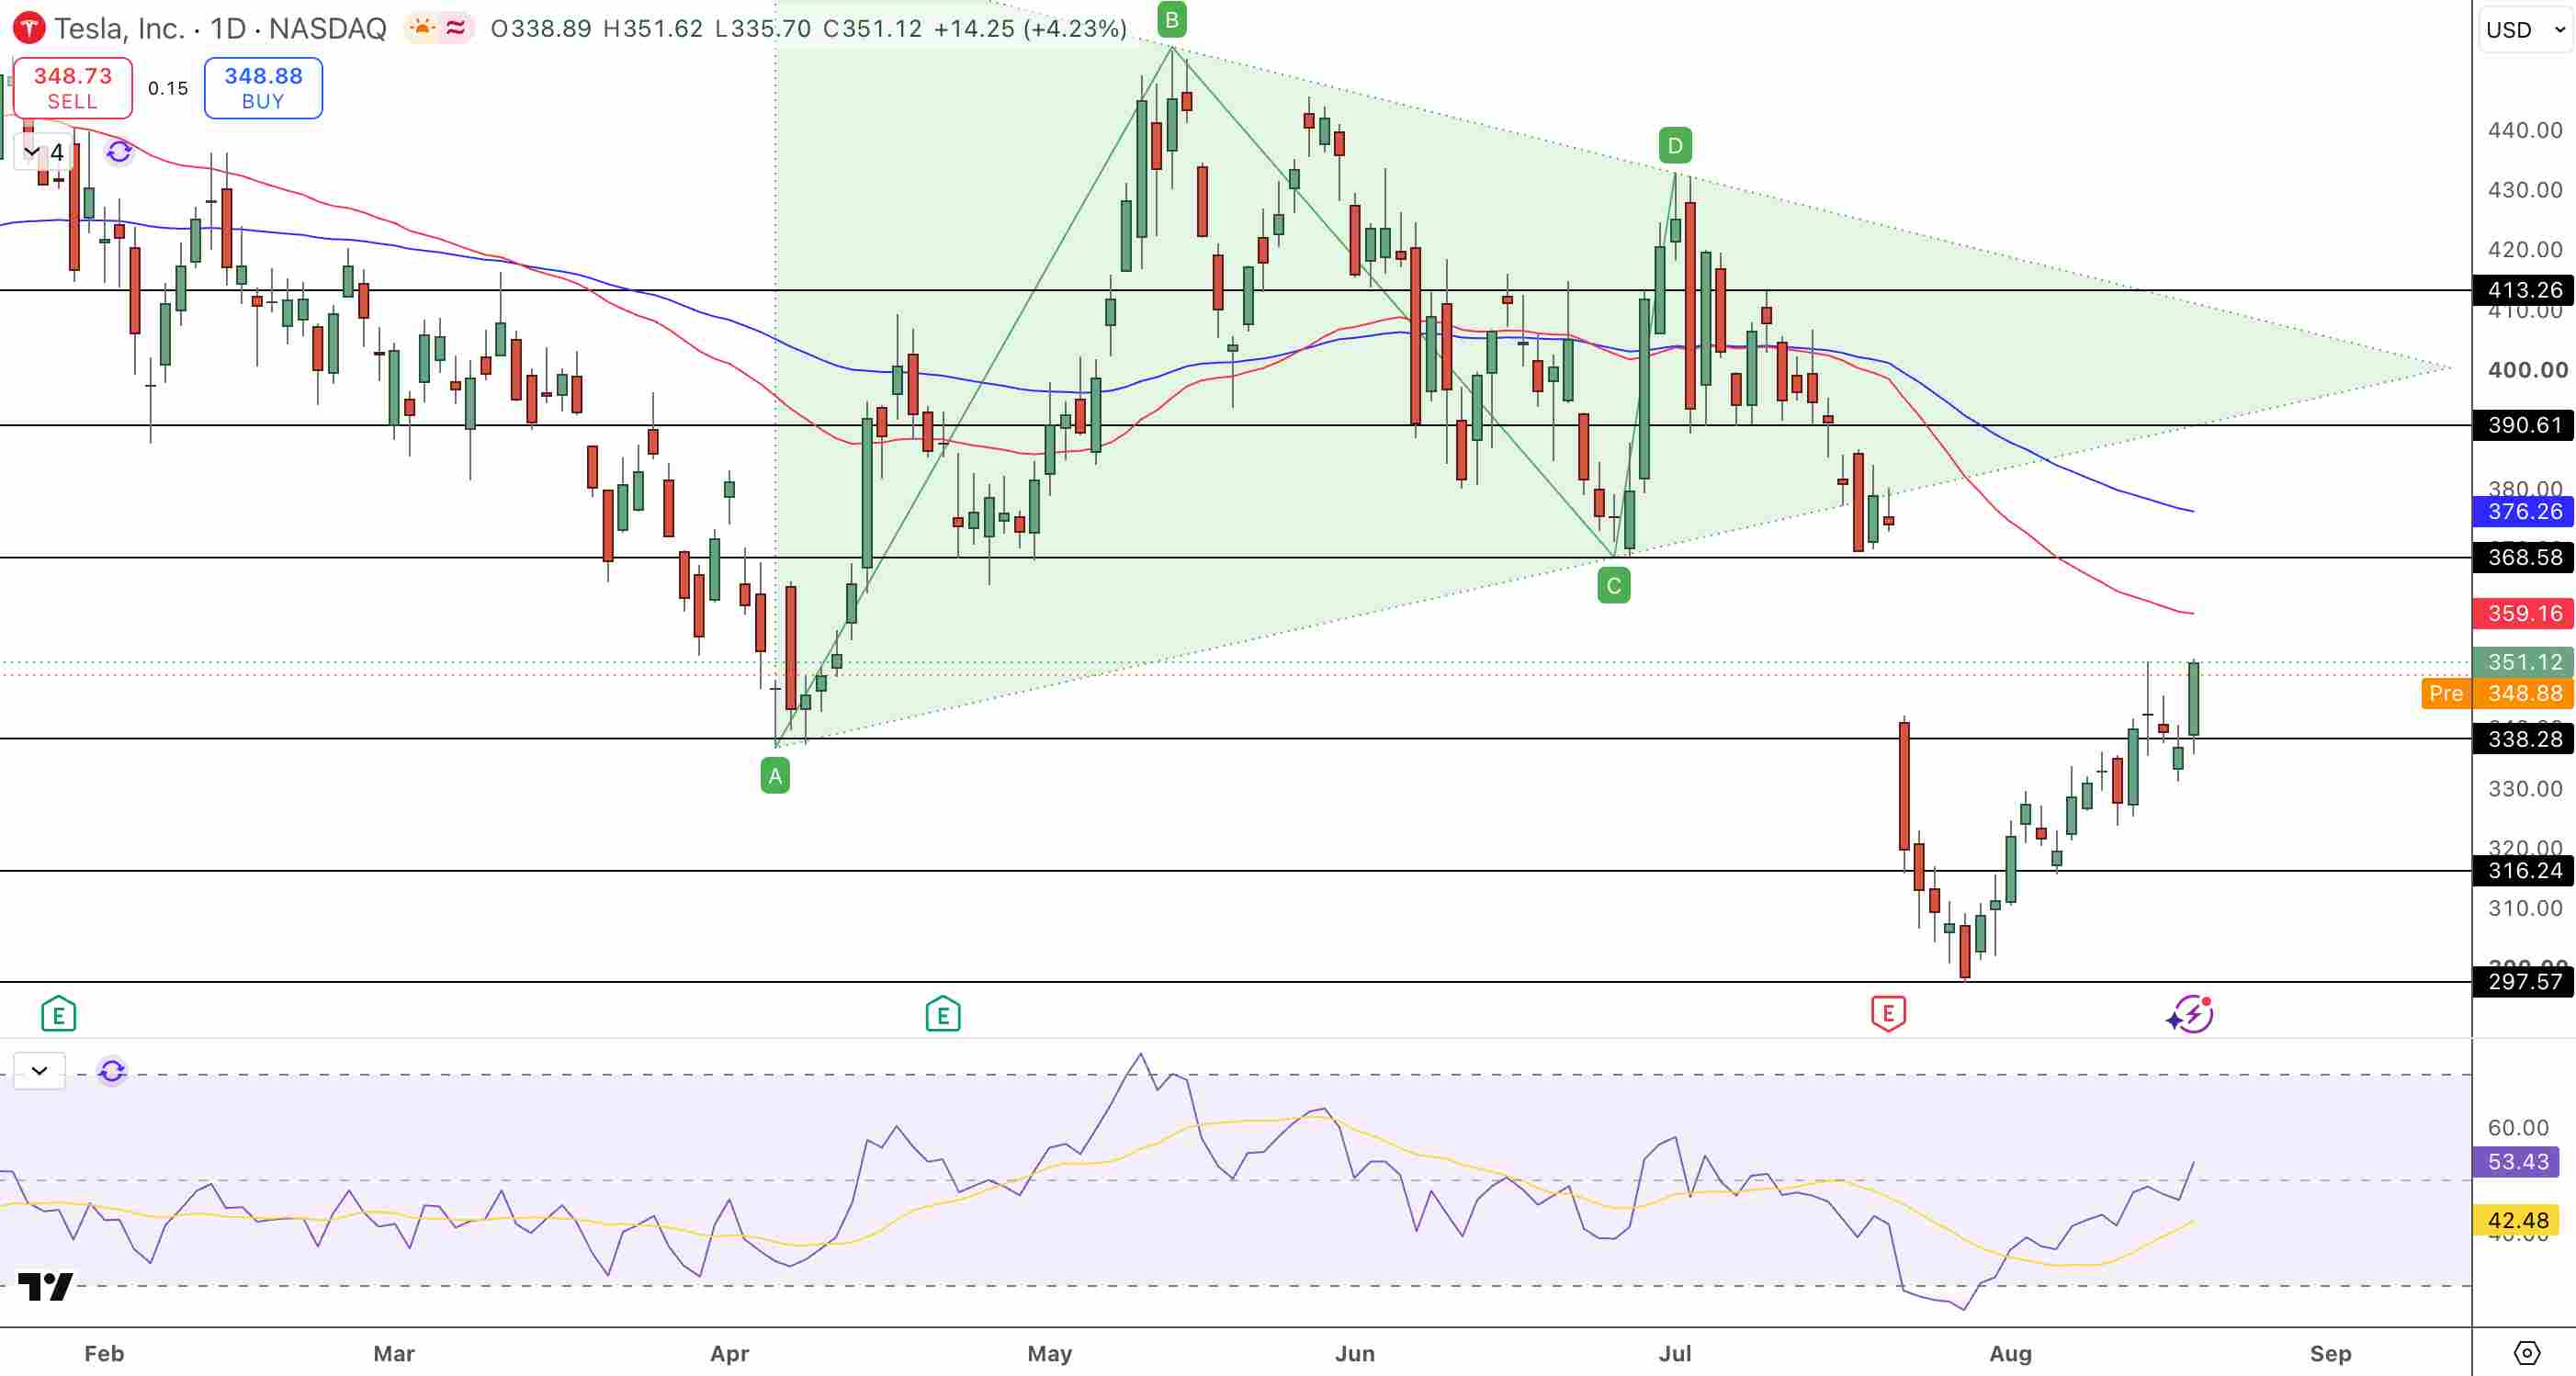
Tesla Price Chart - Source: Tradingview
Now trading around $350.80, if support holds at $338.28 (lower high from August consolidation), then the recovery plan is intact and may allow buyers to return and build towards $359-$369 (the moving average cluster), $376.26 ,and potentially $390.61. Should $338.28 break then support is expected at $316.24.
Key Technical Levels (Into Jackson Hole & Beyond)
- Immediate Resistance: $359 - $369 (moving average cluster)
- Breakout Levels: $376 (breakout level)
- Extended Targets: $390.61
- Current Support: $338.28 (lower high, key hold)
- Breakdown Support: $316.24
The Fundamental Challenge: Capex Outpacing Earnings Growth
Record deliveries in Q2 of 2026 were outrun by capex expenditures and opex that drove margins down to their lowest level while eroding free cash flow. With no doubt, the Company is making an intentional decision to make huge capex commitments for a number of years to position themselves for what they believe will be significant returns in the robotaxi, humanoid robot, and artificial intelligence chip markets. The tradeoff is an inevitable decline in cash flow and deteriorating earnings.
Bottom Line (Aug 20, One Month After Q2 Earnings)
Tesla Q2: Revenue (quarter-over-quarter) was $28.24B (beating expectations), EPS was $0.33, Operating margin was 1.4%, FCF was -$1.09B (quarter over quarter from +$1.44B), capex was $5.79B (up 142%), Full year capex is expected to top $25B, and production of their cyber trucks has begun. They also have begun the deployment of a robotaxi in 7 cities while the first generation of Optimus humanoid robots is being built and the artificial intelligence chips are also beginning production.
Technical: $350.80 TSLA recovering from July 23 crash. Research supports $338 as a strong support level. A further drop breaks support and then $316 comes into play. A breakout above $376 validates the recovery structure and targets $390+. Macro tone from Jackson Hole (Aug 27–29) will set the tone for capex confidence.
For investors: Tesla is moving along an impressive roadmap (Cybercab, Optimus, chips) at a rapid burn rate for growth. Wall Street has the following query to address: Will the capex investments begin to pay off in the period 2027-2028 leading to outsized returns, or would the negative cash flow for an extended period of time force Tesla to slow down or restrict growth and raise capital? Market sentiment for the period Aug 20-22 will be of interest. This is an analysis and should not be construed as an investment recommendation.
Recommended Articles










Comments (0)
Click the $ button, enter the symbol, and select to link a stock, ETF, or other ticker.