

Newmont Corporation Stock (NEM) Opened Down by 3.30% on Jun 10: Facts Behind the Movement

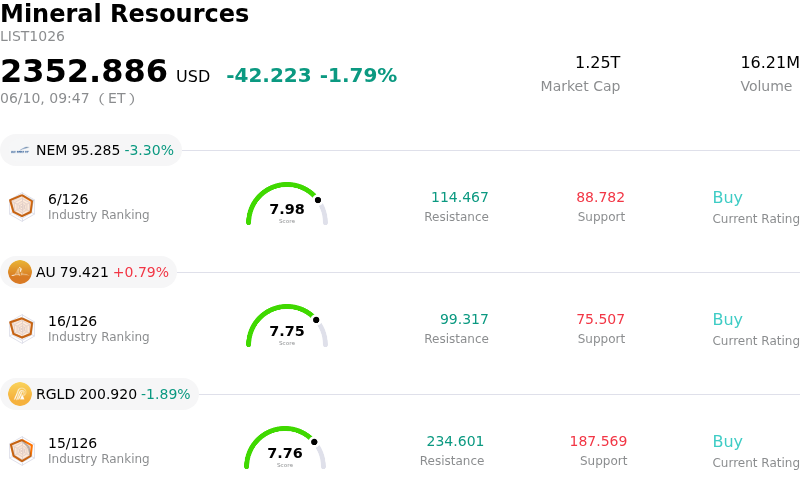
Newmont Corporation (NEM) opened down by 3.30%. The Mineral Resources sector is down by 1.79%. The company underperformed the industry. Top 3 stocks by turnover in the sector: Newmont Corporation (NEM) down 3.30%; Anglogold Ashanti PLC (AU) up 0.79%; Royal Gold Inc (RGLD) down 1.89%.
What is driving Newmont Corporation (NEM)’s stock price down today?
Newmont Corporation's stock experienced a notable decline today, primarily influenced by a significant drop in the price of gold. Gold fell considerably, reaching its lowest level in over two months, with August futures contracts also showing a decrease. This downward pressure on gold is largely attributed to prevailing inflation concerns and the market's anticipation that the US Federal Reserve may continue to hold interest rates steady or even raise them.
Macroeconomic factors played a crucial role in shaping investor sentiment towards gold, and consequently, gold mining equities. The yield on the US 10-Year Treasury Note rose today, making non-yielding assets like gold less appealing to investors. Concurrently, the US Dollar Index strengthened, making dollar-denominated gold more expensive for international buyers and further dampening demand. Expectations regarding Federal Reserve policy have solidified, with a strong consensus that the Fed will maintain its current policy rates. Recent robust US labor market data has also fueled expectations of sustained restrictive monetary policy, with some forecasts even suggesting potential rate hikes later in the year, which typically pressures gold prices.
Despite some positive company-specific developments, such as recent strong quarterly earnings, revenue growth, and an authorized share repurchase program, these factors have been overshadowed by the broader bearish sentiment in the commodity market. The sensitivity of mining stocks like Newmont to gold price fluctuations and overall market risk appetite means that macroeconomic shifts favoring a stronger dollar and higher interest rates tend to weigh heavily on their performance. Investors are keenly awaiting upcoming US inflation data, which could further influence the Federal Reserve's policy trajectory and market expectations.
Technical Analysis of Newmont Corporation (NEM)
Technically, Newmont Corporation (NEM) shows a MACD (12,26,9) value of [-1.79], indicating a sell signal. The RSI at 35.25 suggests neutral condition and the Williams %R at -78.86 suggests oversold condition. Please monitor closely.
Media Coverage of Newmont Corporation (NEM)
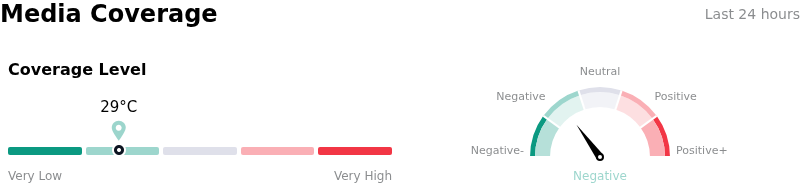
In terms of media coverage, Newmont Corporation (NEM) shows a coverage score of 29, indicating a low level of media attention. The overall market sentiment index is currently in bearish zone.
Fundamental Analysis of Newmont Corporation (NEM)
Newmont Corporation (NEM) is in the Mineral Resources industry. Its latest annual revenue is $22.67B, ranking 8 in the industry. The net profit is $7.08B, ranking 3 in the industry. Company Profile
Over the past month, multiple analysts have rated the company as Buy, with an average price target of $140.33, a high of $205.00, and a low of $64.32.
More details about Newmont Corporation (NEM)
Company Specific Risks:
- Newmont anticipates a planned production trough in 2026, with attributable gold production expected to decline to approximately 5.3 million ounces from 5.9 million ounces in 2025, combined with a projected increase in All-in Sustaining Costs (AISC) to $1,680 per ounce from $1,358 in 2025, which could pressure profit margins.
- Newmont's stock significantly underperformed the broader market and its sector, closing down 7.96% on June 5, 2026, compared to the S&P 500's 2.65% loss on the same day, and depreciating 4.55% over the past month while the Basic Materials sector gained 4.79%.
- The company projects substantial elevated sustaining capital expenditure of approximately $1.95 billion for 2026 to advance critical tailings facility work and other integrity enhancements, which represents a considerable capital outlay that could impact free cash flow.
This article may include AI-generated content that is human-reviewed, which is for reference and general information purposes only and does not constitute investment advice.
Recommended Articles


Comments (0)
Click the $ button, enter the symbol, and select to link a stock, ETF, or other ticker.