

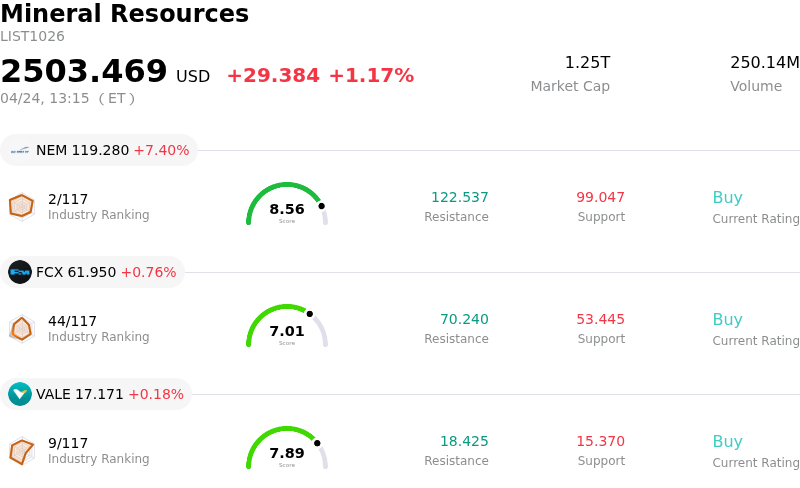
Newmont Corporation Stock (NEM) Moved Up by 7.40% on Apr 24: What Signal Does It Send?

Newmont Corporation (NEM) moved up by 7.40%. The Mineral Resources sector is up by 1.17%. The company outperformed the industry. Top 3 stocks by turnover in the sector: Newmont Corporation (NEM) up 7.40%; Freeport-McMoRan Inc (FCX) up 0.76%; Vale SA (VALE) up 0.18%.
What is driving Newmont Corporation (NEM)’s stock price up today?
Newmont Corporation (NEM) experienced significant upward movement, primarily driven by its robust first-quarter 2026 earnings report released on April 23rd. The company announced record quarterly earnings and free cash flow, surpassing analyst expectations for both earnings per share and revenue. This strong financial performance was largely fueled by elevated realized gold prices during the quarter.
Further bolstering investor confidence, Newmont's board approved an additional $6.0 billion share repurchase authorization, following the completion of previous programs. This action underscores management's commitment to returning capital to shareholders and signals a positive outlook on the company's future cash generation capabilities. Despite a reported decline in gold production for the quarter, the impact on profitability was mitigated by the significantly higher average realized gold prices year-over-year.
The general macroeconomic environment also contributed to the positive sentiment. Gold prices showed an increase on April 24, 2026, continuing a trend of strong performance over the past month and year, partially influenced by ongoing geopolitical tensions. Additionally, several analyst firms had recently issued or updated price targets for NEM, with some maintaining or raising their ratings, reflecting a generally optimistic view on the stock's prospects.
Technical Analysis of Newmont Corporation (NEM)
Technically, Newmont Corporation (NEM) shows a MACD (12,26,9) value of [0.52], indicating a neutral signal. The RSI at 47.44 suggests neutral condition and the Williams %R at -77.48 suggests oversold condition. Please monitor closely.
Fundamental Analysis of Newmont Corporation (NEM)
Newmont Corporation (NEM) is in the Mineral Resources industry. Its latest annual revenue is $22.67B, ranking 8 in the industry. The net profit is $7.08B, ranking 3 in the industry. Company Profile
Over the past month, multiple analysts have rated the company as Buy, with an average price target of $139.76, a high of $205.00, and a low of $64.32.
More details about Newmont Corporation (NEM)
Company Specific Risks:
- Newmont's stock is currently assessed as significantly overvalued by GuruFocus, trading approximately 70.9% above its GF Value, which suggests a potential lack of margin of safety for investors.
- Analysts from BMO Capital noted a potential for a slight sequential decline in Newmont's second-quarter production compared to the first quarter, which could impact short-term operational metrics.
- Despite reporting strong first-quarter earnings and revenue that exceeded expectations, Newmont's stock experienced a decline in aftermarket trading, indicating possible profit-taking or underlying selling pressure.
- Newmont remains highly sensitive to fluctuations in gold prices and increases in energy costs, with historical data showing that even a 1% decline in gold prices can lead to a 3% drop in the company's stock, directly impacting profitability.
This article may include AI-generated content that is human-reviewed, which is for reference and general information purposes only and does not constitute investment advice.
Recommended Articles


Comments (0)
Click the $ button, enter the symbol, and select to link a stock, ETF, or other ticker.