


USD/CAD Price Forecast: Testing six-week lows at 1.3968 amid a softer US Dollar



- USD/CAD extends losses for the third consecutive day and hits fresh six-week lows below 1.3960.
- The US Dollar loses ground as higher demand for US Treasury bonds has sent yields tumbling.
- The Canadian Dollar rallies with Oil prices near five-month highs
The US Dollar (USD) heads lower for the third consecutive day against the Canadian Dollar (CAD) on Friday, as risk aversion pushes US Treasury yields lower, while high Oil prices boost the commodity-sensitive Canadian Dollar. The USD/CAD pair is testing six-week lows at 1.3968, on track for a more than 2% decline in a three-week selloff.
Renewed concerns about an AI bubble, following disappointing results from Google Alphabet, have triggered a rush from equity markets to the safety of US Government Bonds during the US and Asian sessions. US Treasury yields have extended their reversal –the US 10-year yield has lost more than 30 basis points in October, which has increased bearish pressure on the Greenback.
The Loonie, on the other hand, remains buoyed by the high prices of Oil, Canada’s main export. The Brent Oil barrel remains above 112.00, set to close the month with a nearly 20% appreciation as the US and Iran remain far from a peace deal and attacks on vessels attempting to cross the Strait of Hormuz continue.
Technical Analysis: Below 1.3968, the next target is the 1.3900 area
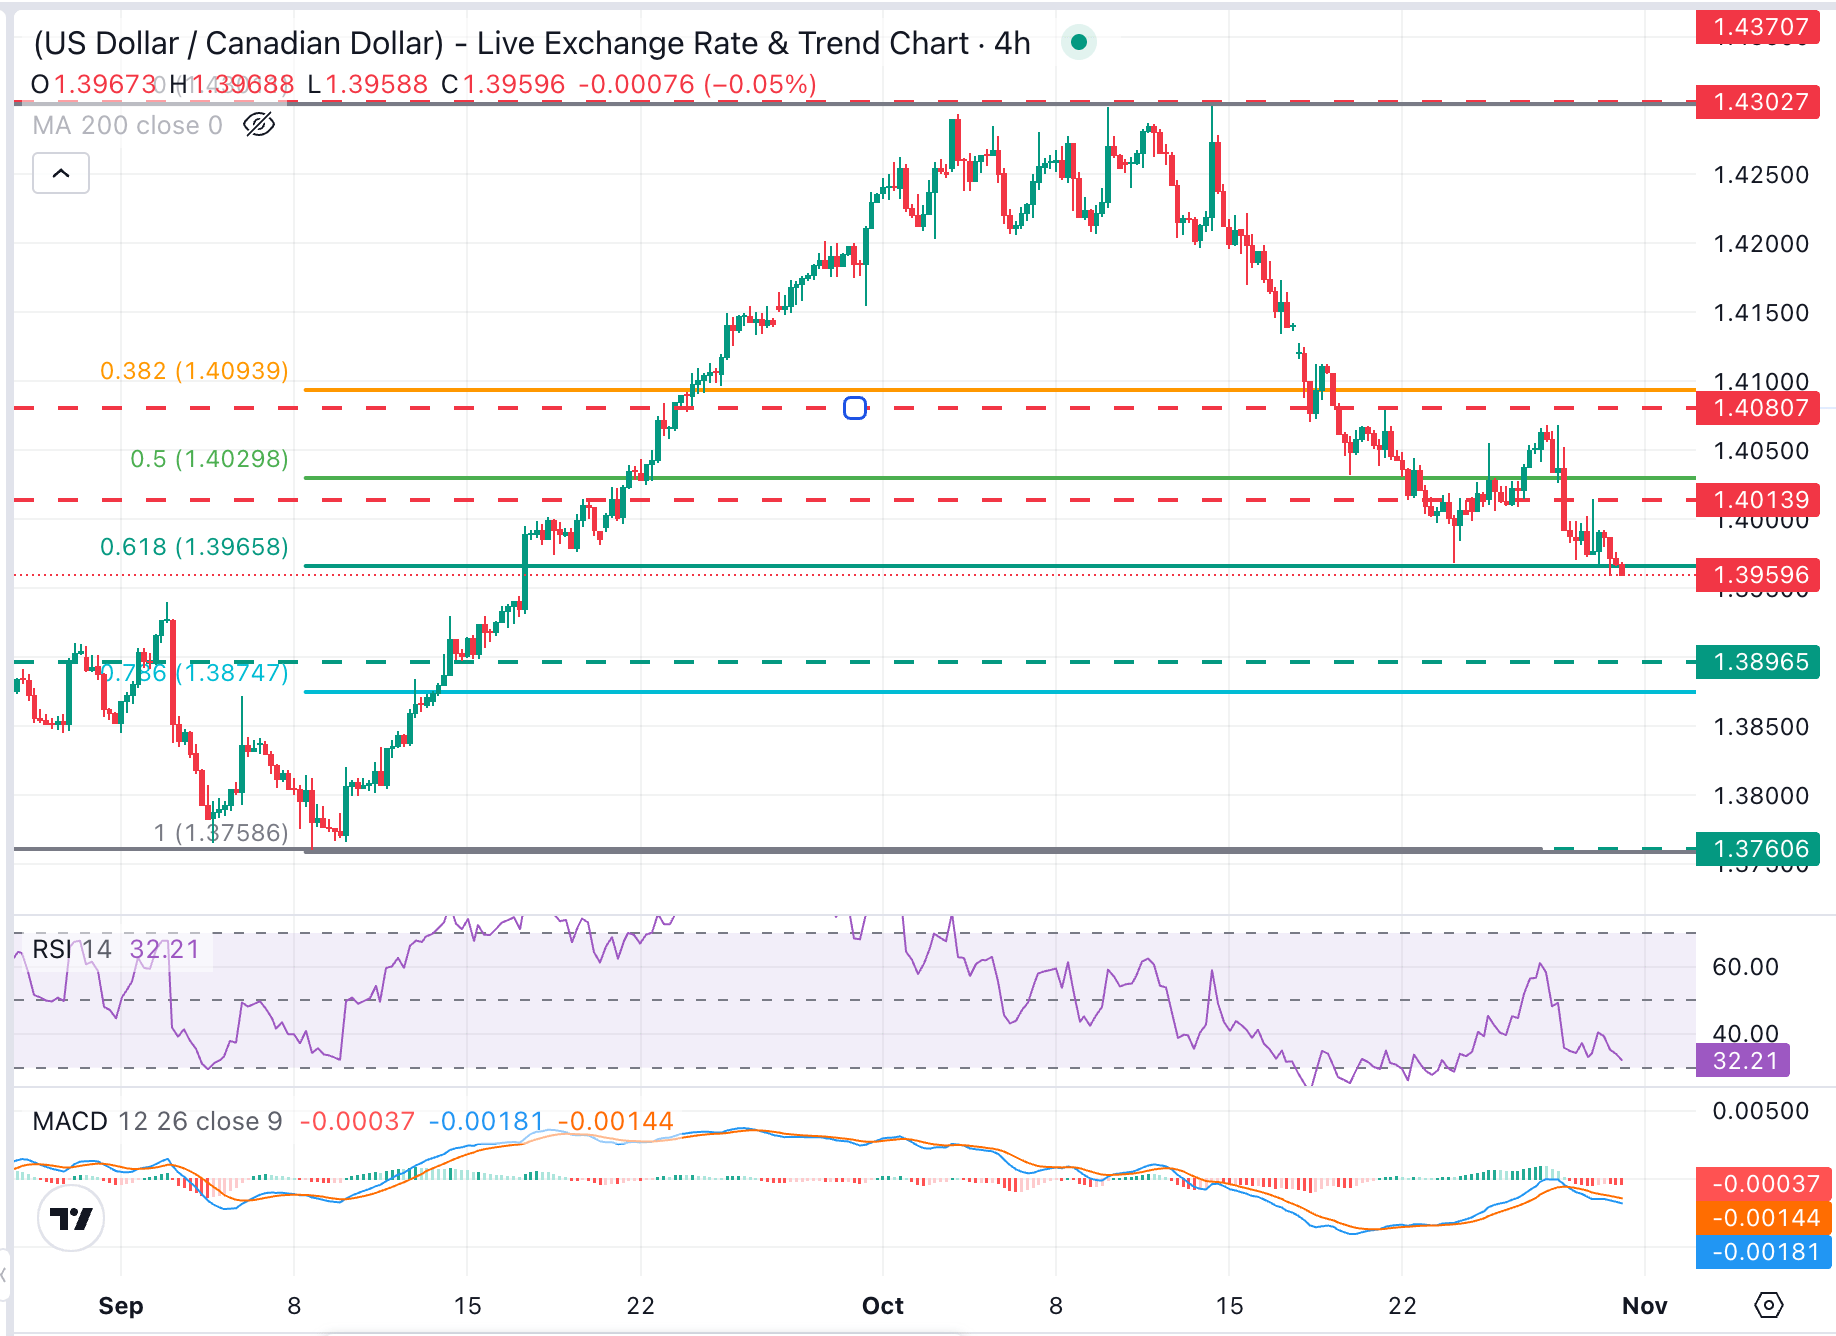
USD/CAD trades around 1.3961, holding a negative trend, with the 4-hour Relative Strength Index (14) at 32.5, near oversold territory, and the Moving Average Convergence Divergence (MACD) marginally below zero, which shows that bears are fully in control.
A confirmation below the support area around 1.3968 (October 23 low) would bring the mid-September lows, around 1.3900, and the 78.6% Fibonacci retracement level, near 1.3875, into focus.
Bulls, on the contrary, should breach Thursday's high, around the 1.4000 psychological area and the October 21 and 23 highs in the 1.4070-1.4080 area to ease downside pressure.
(The technical analysis of this story was written with the help of an AI tool. Know more.)
Canadian Dollar Price Today
The table below shows the percentage change of Canadian Dollar (CAD) against listed major currencies today. Canadian Dollar was the strongest against the US Dollar.
| USD | EUR | GBP | JPY | CAD | AUD | NZD | CHF | |
|---|---|---|---|---|---|---|---|---|
| USD | -0.16% | -0.39% | -0.27% | -0.21% | -0.02% | -0.17% | -0.38% | |
| EUR | 0.16% | -0.23% | -0.11% | -0.04% | 0.16% | -0.02% | -0.22% | |
| GBP | 0.39% | 0.23% | 0.13% | 0.19% | 0.38% | 0.22% | 0.00% | |
| JPY | 0.27% | 0.11% | -0.13% | 0.07% | 0.25% | 0.09% | -0.11% | |
| CAD | 0.21% | 0.04% | -0.19% | -0.07% | 0.18% | 0.03% | -0.18% | |
| AUD | 0.02% | -0.16% | -0.38% | -0.25% | -0.18% | -0.16% | -0.36% | |
| NZD | 0.17% | 0.02% | -0.22% | -0.09% | -0.03% | 0.16% | -0.20% | |
| CHF | 0.38% | 0.22% | -0.01% | 0.11% | 0.18% | 0.36% | 0.20% |
The heat map shows percentage changes of major currencies against each other. The base currency is picked from the left column, while the quote currency is picked from the top row. For example, if you pick the Canadian Dollar from the left column and move along the horizontal line to the US Dollar, the percentage change displayed in the box will represent CAD (base)/USD (quote).
Recommended Articles









Comments (0)
Click the $ button, enter the symbol, and select to link a stock, ETF, or other ticker.