


GBP/JPY Price Forecast: Struggles at 217.00, recoils towards 216.50



- GBP/JPY slips below prior YTD peak after false breakout.
- Break above 217.22 exposes 218.00 and 220.00 resistance.
- Drop below 215.33 targets 215.00 and 50-day SMA.
The GBP/JPY reverses course on Tuesday, loses 0.24% as the Japanese Yen recovered some ground against most G8 FX currencies, except for the US Dollar. At the time of writing, the cross-pair trades at 216.51 after reaching a multi-year high of 217.22.
GBP/JPY Price Forecast: Technical outlook
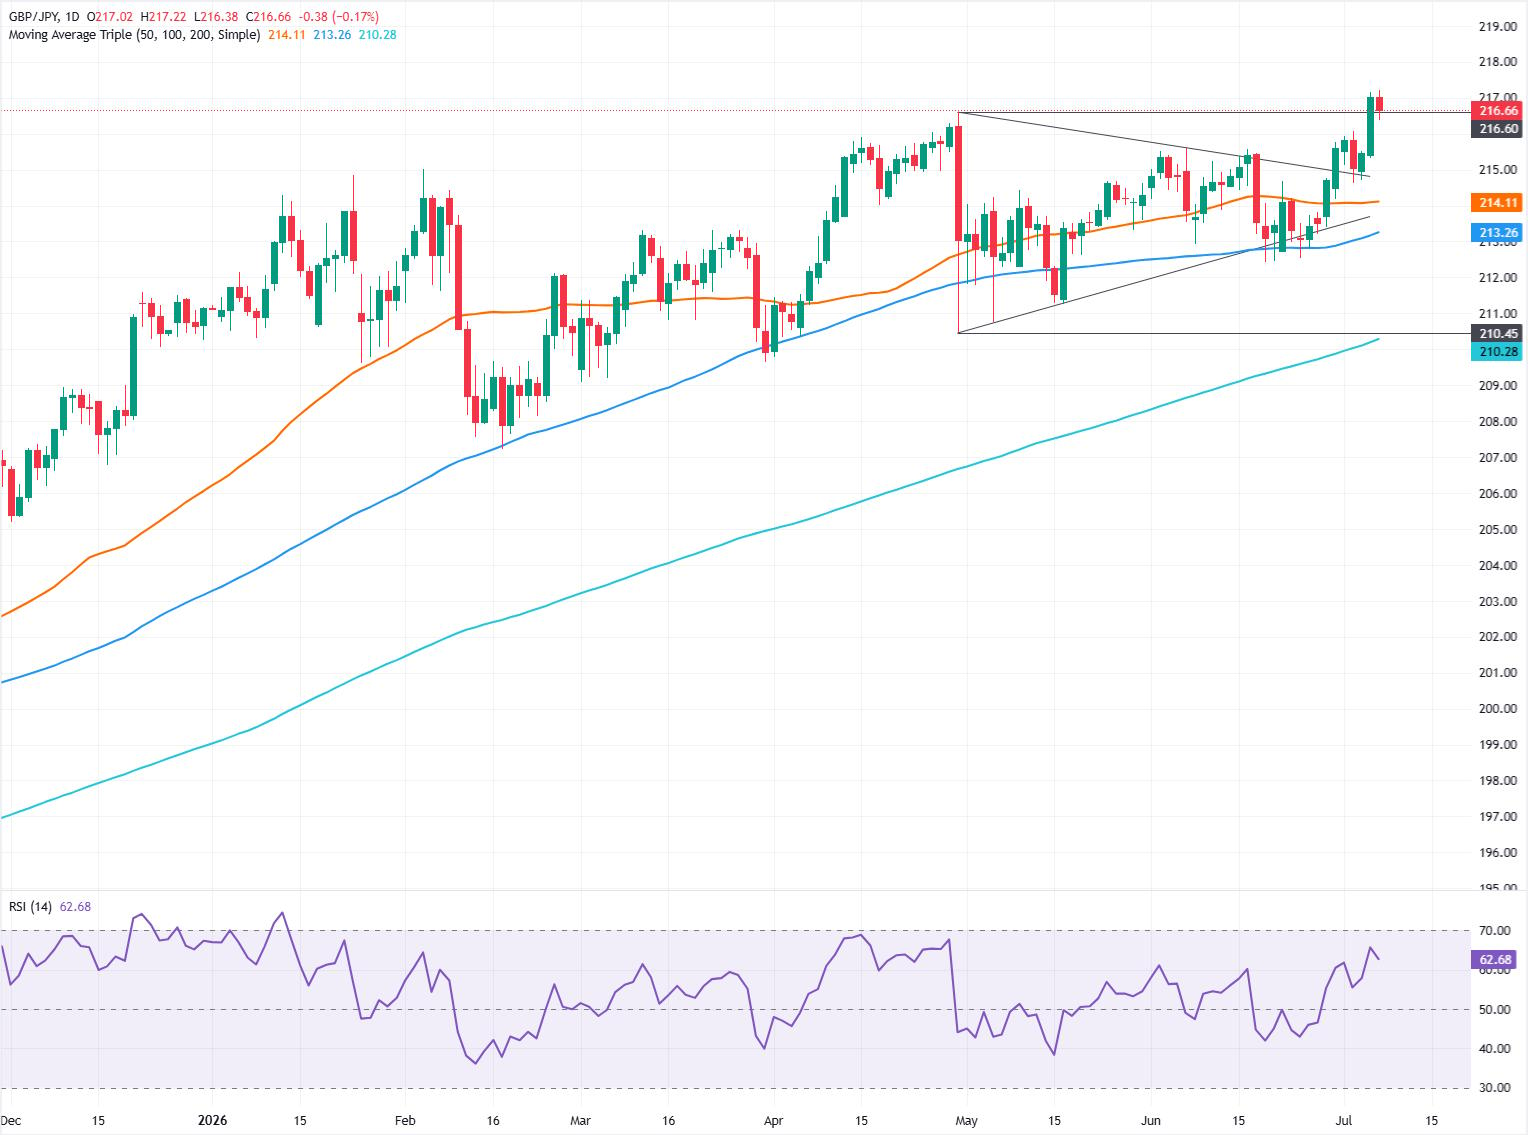
The bullish bias remains intact as the GBP/JPY printed a year-to-date (YTD) high at 217.22, which could open the door for further upside. However, it was a false breakout, as the cross pair tumbled below the previous YTD peak at 216.46, opening the door for a test of 216.00. Fears of a possible Bank of Japan (BoJ) intervention in the foreign exchange markets could prompt traders to book profits.
For a bullish continuation, buyers must clear the 217.00 figure, followed by the high of the day (HOD) fof 217.22 ‒ also the high of the year, which clears the way to challenge 218.00. On further strength, the next area of interest would be the 220.00 milestone.
On further weakness, the GBP/JPY first support would be the July 6 low at 215.33, followed by 215.00. Below this level, the next support would be the 50-day Simple Moving Average (SMA) at 214.11, followed by the 100-day SMA at 213.26.
GBP/JPY Price Chart ‒ Daily
Japanese Yen Price This week
The table below shows the percentage change of Japanese Yen (JPY) against listed major currencies this week. Japanese Yen was the strongest against the Swiss Franc.
| USD | EUR | GBP | JPY | CAD | AUD | NZD | CHF | |
|---|---|---|---|---|---|---|---|---|
| USD | 0.29% | -0.07% | 0.52% | 0.01% | 0.15% | 0.61% | 0.61% | |
| EUR | -0.29% | -0.37% | 0.24% | -0.30% | -0.09% | 0.26% | 0.29% | |
| GBP | 0.07% | 0.37% | 0.50% | 0.08% | 0.30% | 0.64% | 0.68% | |
| JPY | -0.52% | -0.24% | -0.50% | -0.54% | -0.25% | 0.09% | 0.10% | |
| CAD | -0.01% | 0.30% | -0.08% | 0.54% | 0.28% | 0.65% | 0.59% | |
| AUD | -0.15% | 0.09% | -0.30% | 0.25% | -0.28% | 0.34% | 0.39% | |
| NZD | -0.61% | -0.26% | -0.64% | -0.09% | -0.65% | -0.34% | 0.03% | |
| CHF | -0.61% | -0.29% | -0.68% | -0.10% | -0.59% | -0.39% | -0.03% |
The heat map shows percentage changes of major currencies against each other. The base currency is picked from the left column, while the quote currency is picked from the top row. For example, if you pick the Japanese Yen from the left column and move along the horizontal line to the US Dollar, the percentage change displayed in the box will represent JPY (base)/USD (quote).
Recommended Articles








Comments (0)
Click the $ button, enter the symbol, and select to link a stock, ETF, or other ticker.