


Injective Price Forecast: Mounting selling pressure threatens a long-term support trendline



- Injective hovers below $7.50 on Thursday after a 6% decline the previous day.
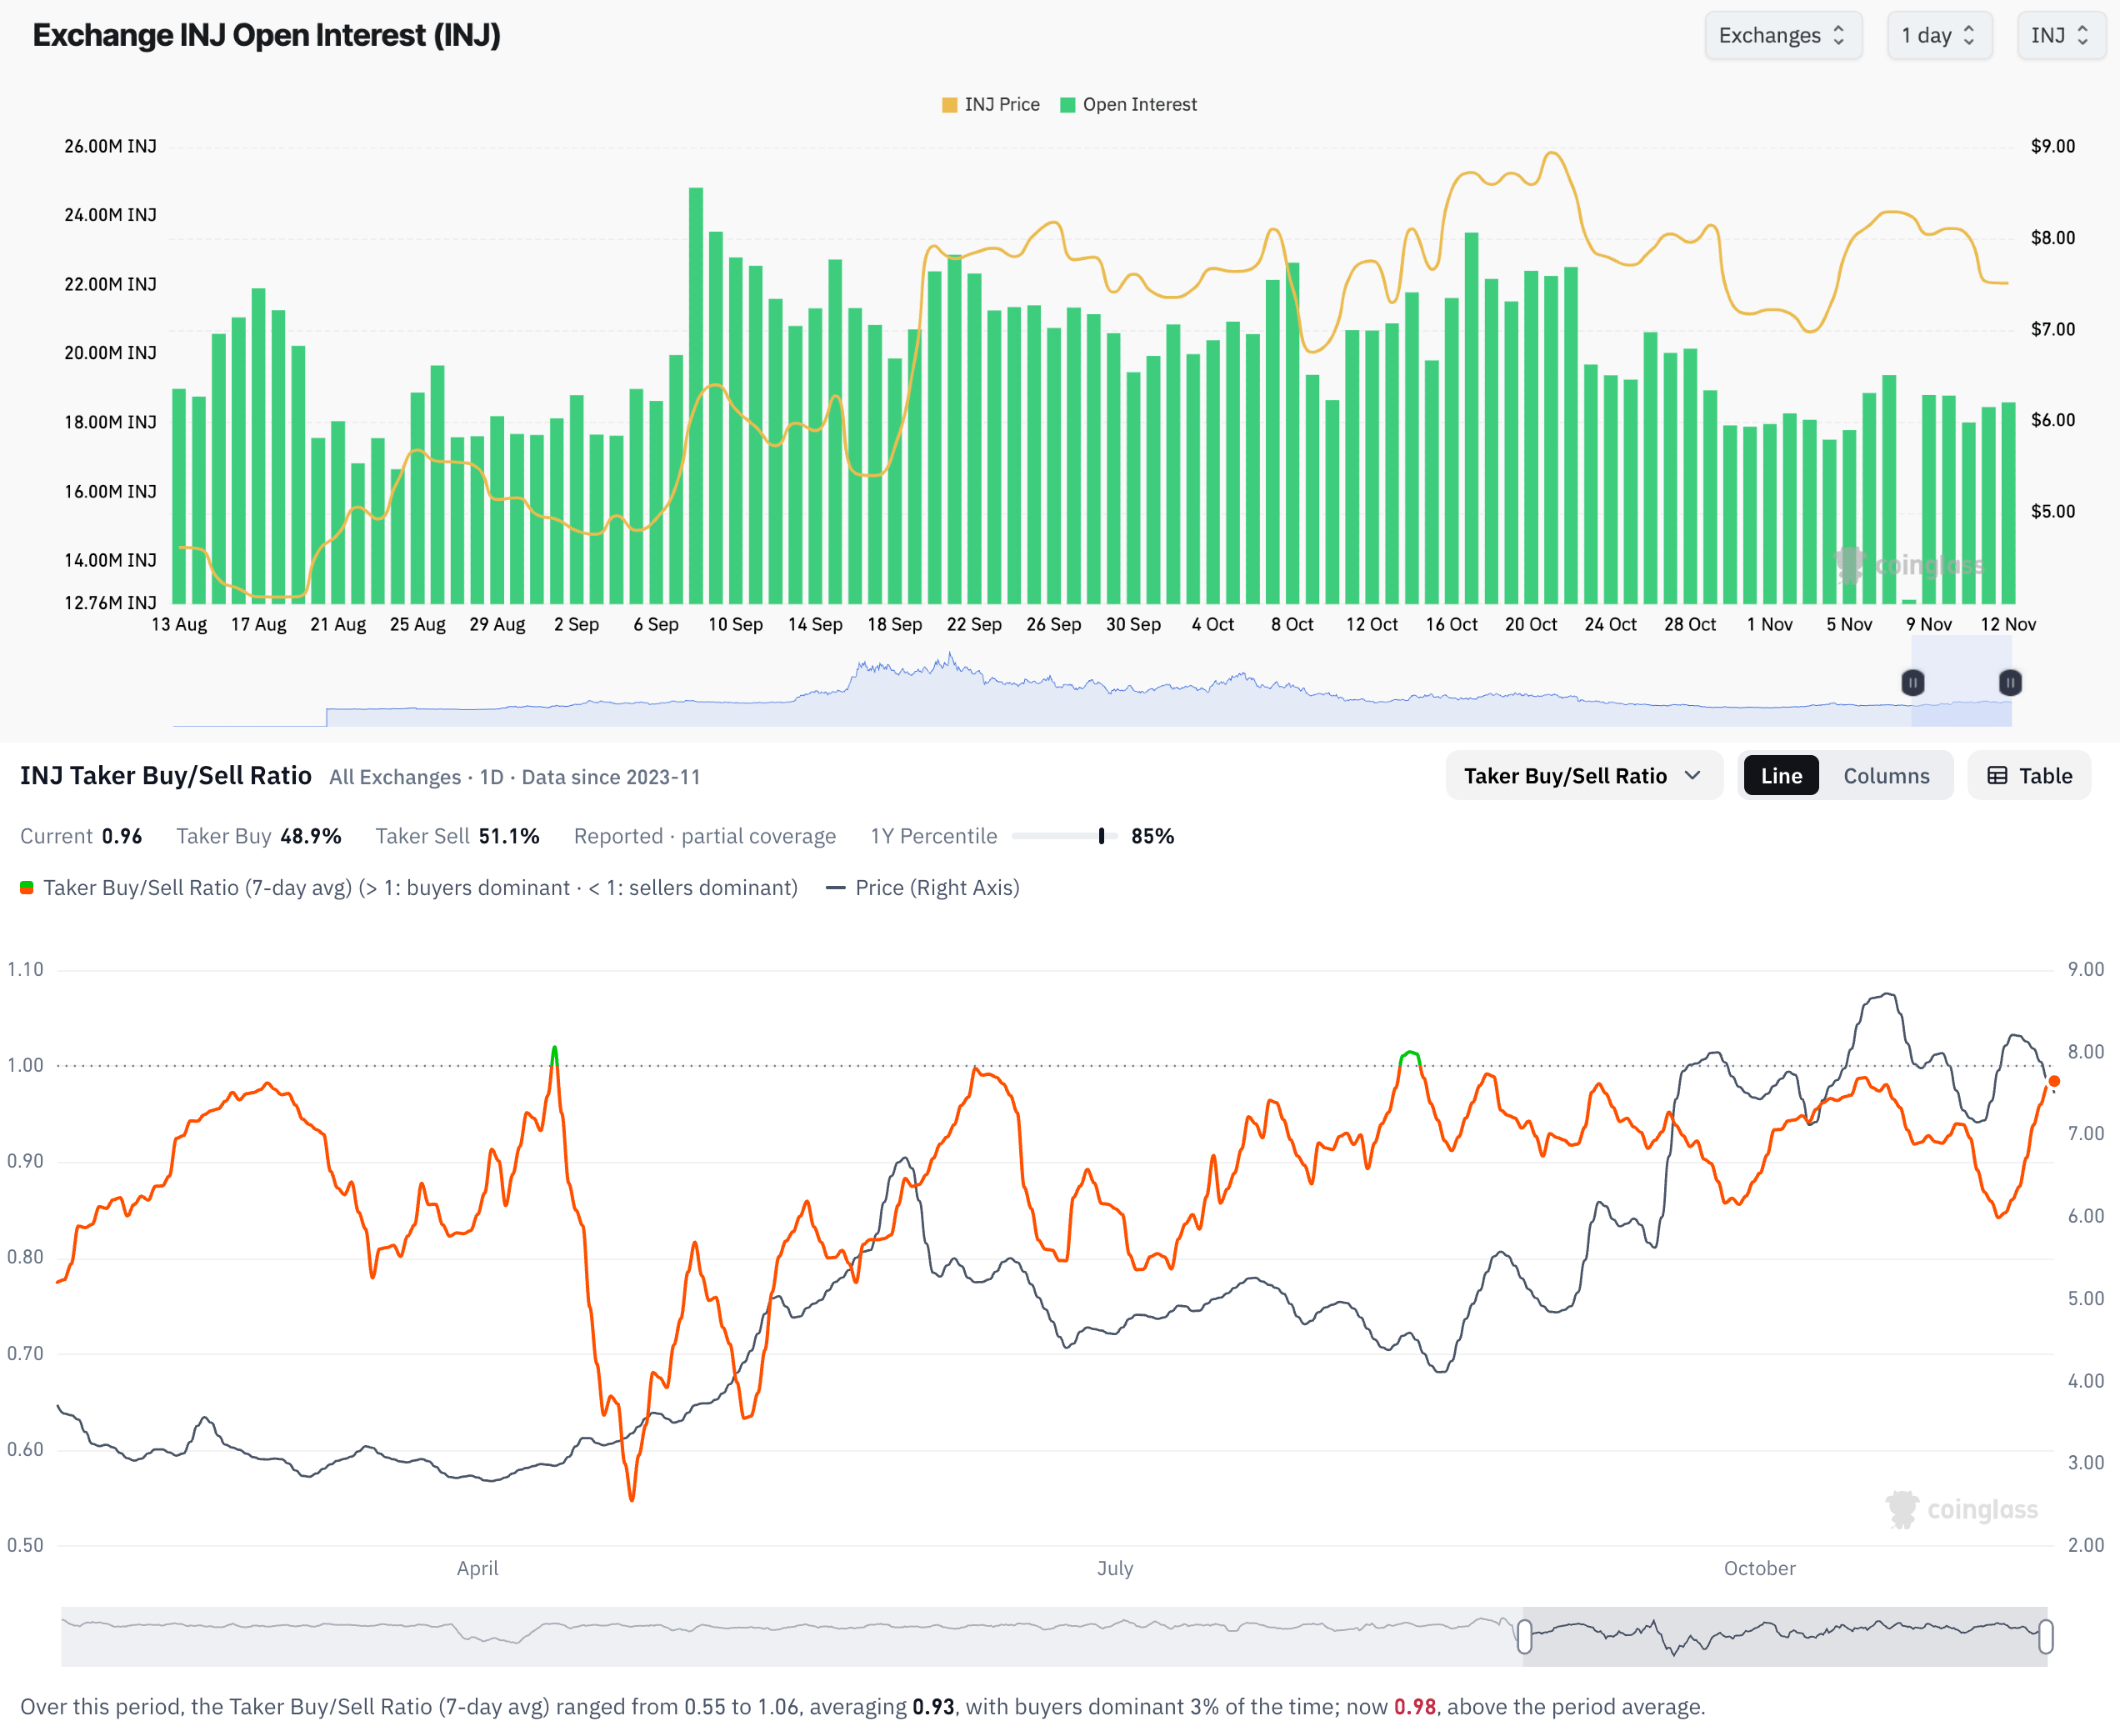
- Derivatives data point to buy-side weakness as the taker buy-to-sell ratio remains below 1 amid declining Open Interest.
- The technical outlook for INJ is mixed, with bullish momentum easing to sub-bearish levels.
Injective (INJ) extends losses below $7.50 at press time on Thursday, attracting sellers after the previous day’s 6% decline. The derivatives market shows a sell-side bias among traders, as market orders continue to sweep resting bids amid declining Open Interest in INJ futures. The technical outlook for INJ is mixed, with a key support trendline in focus.
Injective loses appeal in the derivatives market
Injective’s demand in the derivatives market is declining, suggesting weak upside belief among traders. CoinGlass data shows the INJ futures Open Interest (OI) is down to 18.61 million INJ, reflecting a steady decline since the October 17 peak of 23.52 million INJ. At the same time, the taker buy-to-sell ratio remains below 1 at 0.96, with 51.1% of taker orders being sells, reaffirming a selling bias.
Technical outlook: Will Injective defend its support trendline?
Injective trades at $7.4800 at press time on Thursday, consolidating just under the 50-day Exponential Moving Average (EMA) at $7.5558 while still holding above the reclaimed trendline support around $7.1868. This layout keeps the near-term bias broadly neutral, while the 200-day EMA at $6.2712 underpins the broader constructive structure.
However, momentum shows near-term weakness, with the Moving Average Convergence Divergence (MACD) crossing below its signal line and the Relative Strength Index (RSI) around 46, hinting at fading bullish momentum.
On the downside, initial support is seen at the trendline near $7.1868, followed by the horizontal floor at $6.7140 and the 200-day EMA at $6.2712.
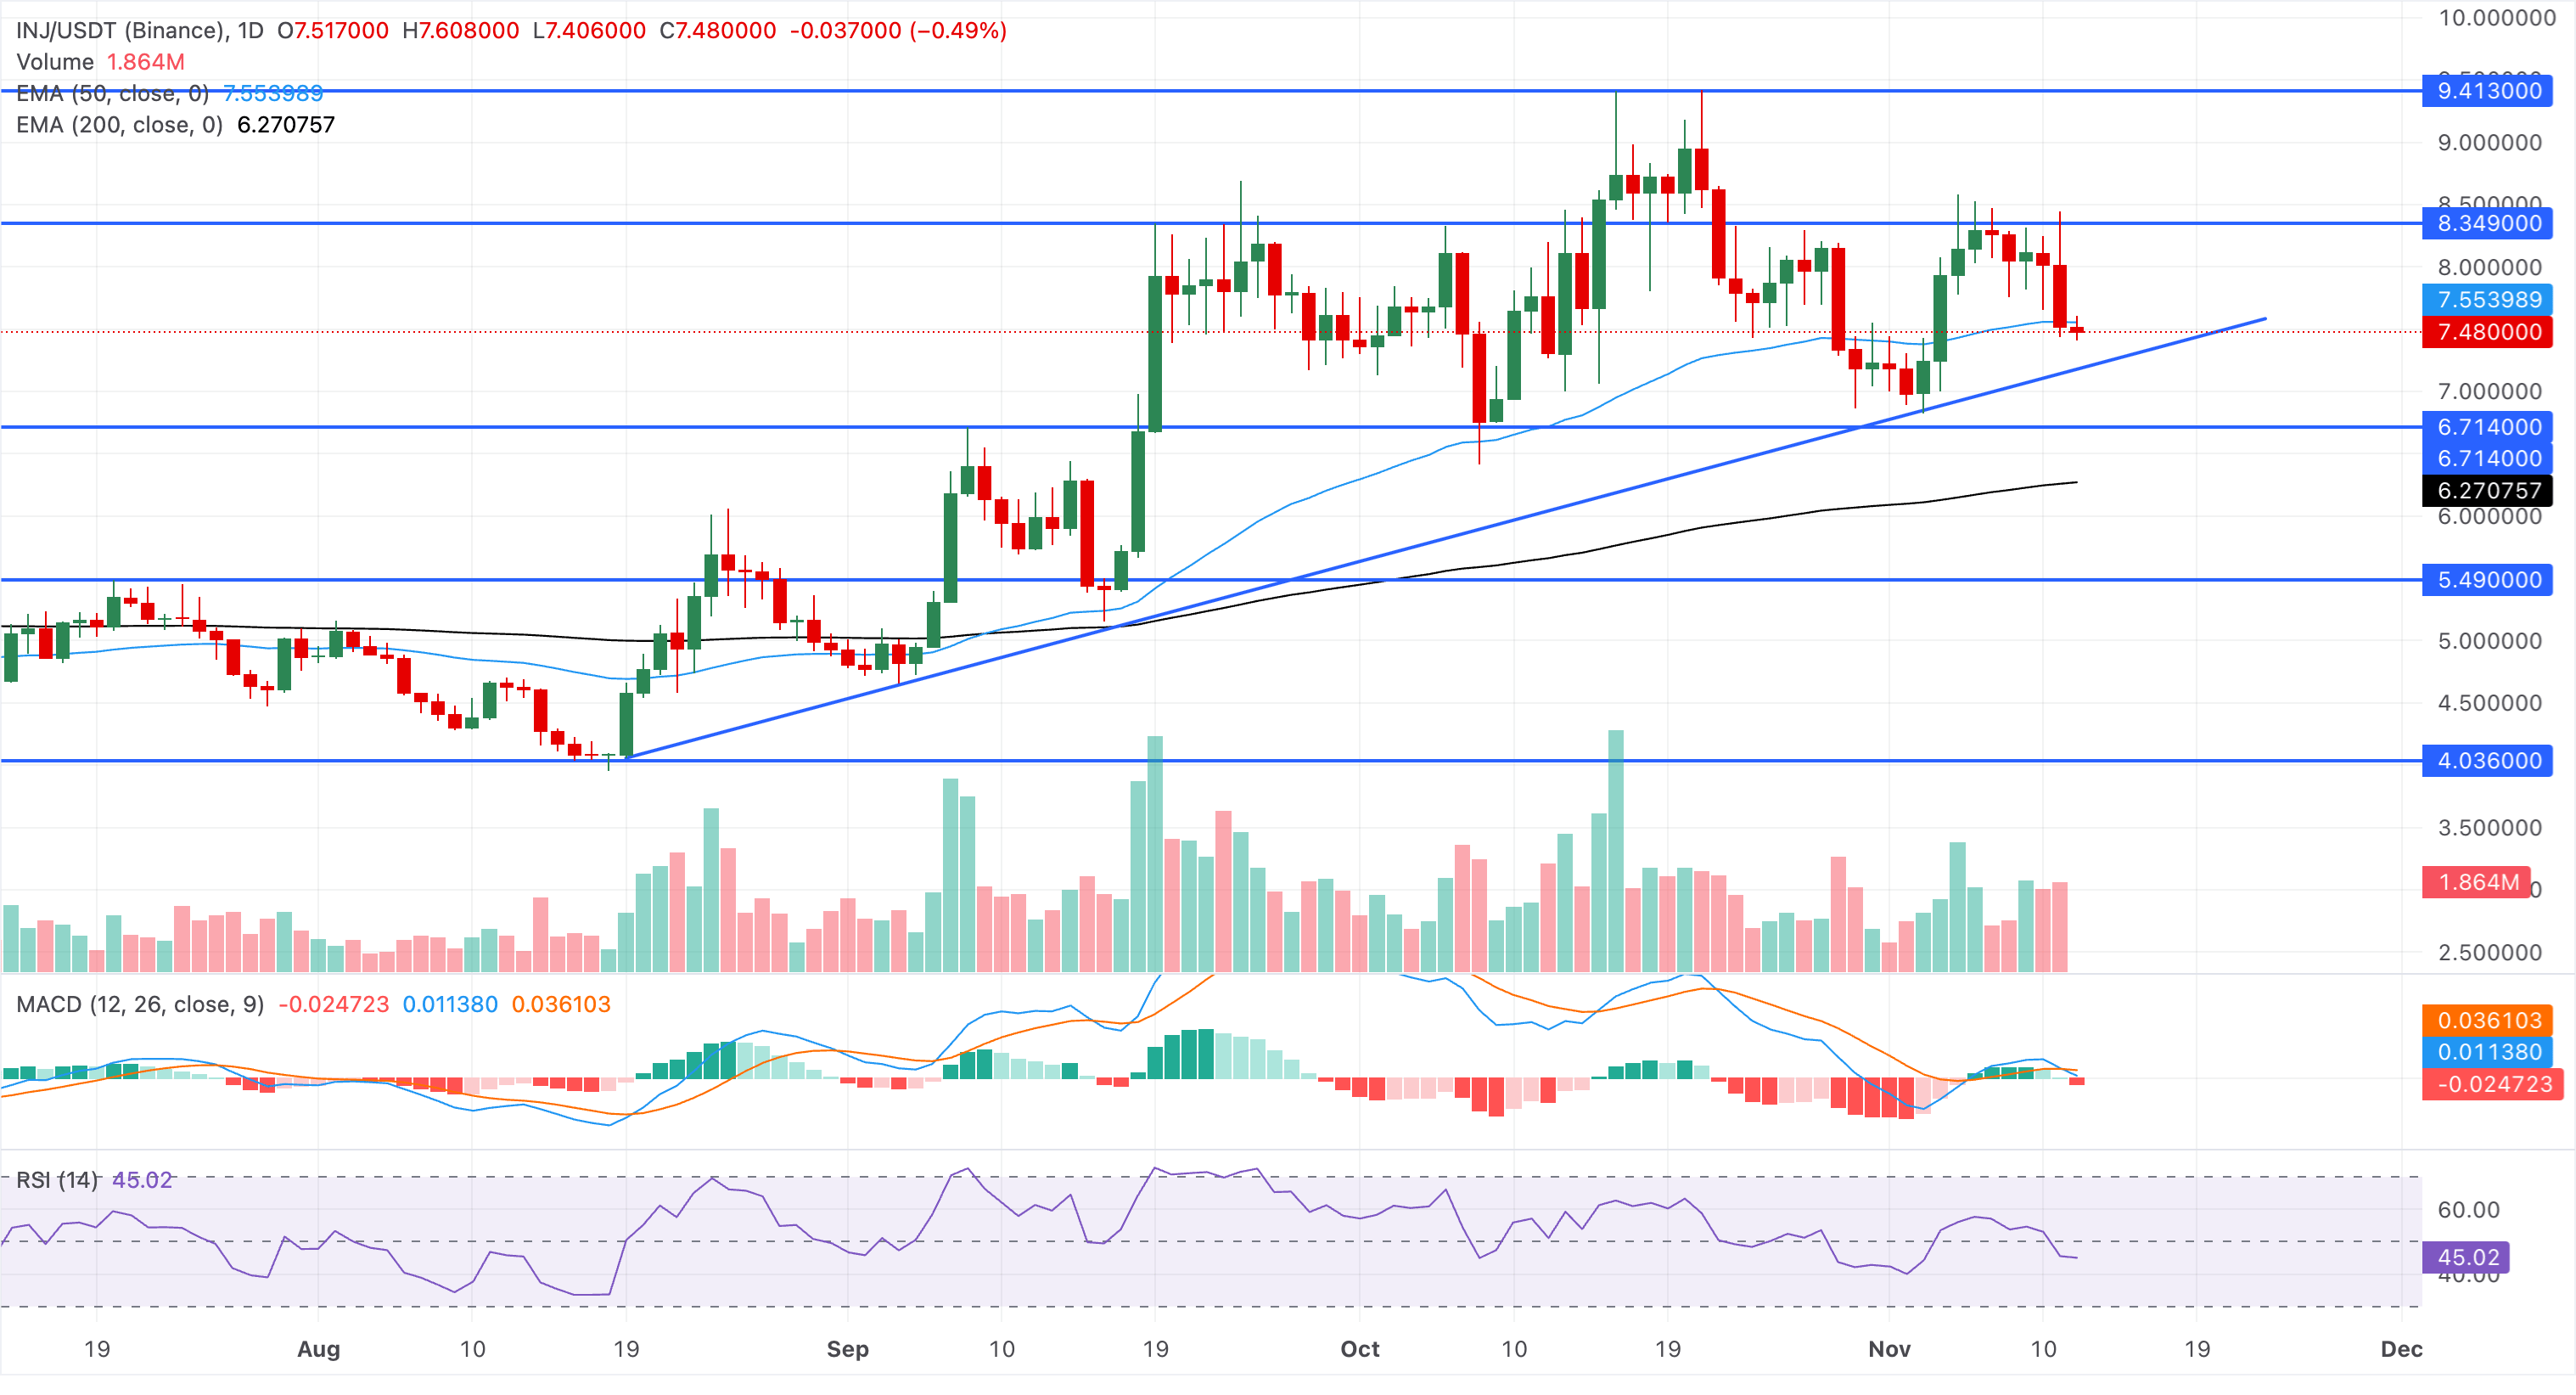
On the topside, immediate resistance aligns with the 50-day EMA at $7.5539, with a stronger cap emerging at the horizontal barrier around $8.3490, which capped gains last week. A daily close above $8.3490 would open the door for a retest of the $9.4130 barrier.
(The technical analysis of this story was written with the help of an AI tool. Know more.)
Recommended Articles










Comments (0)
Click the $ button, enter the symbol, and select to link a stock, ETF, or other ticker.