


Pi Network Price Forecast: Mild recovery lifts key two-month long resistance breakout hopes



- Pi Network edges higher on Tuesday, holding between its 50-day EMA at $0.0940 and the $0.0971 key resistance.
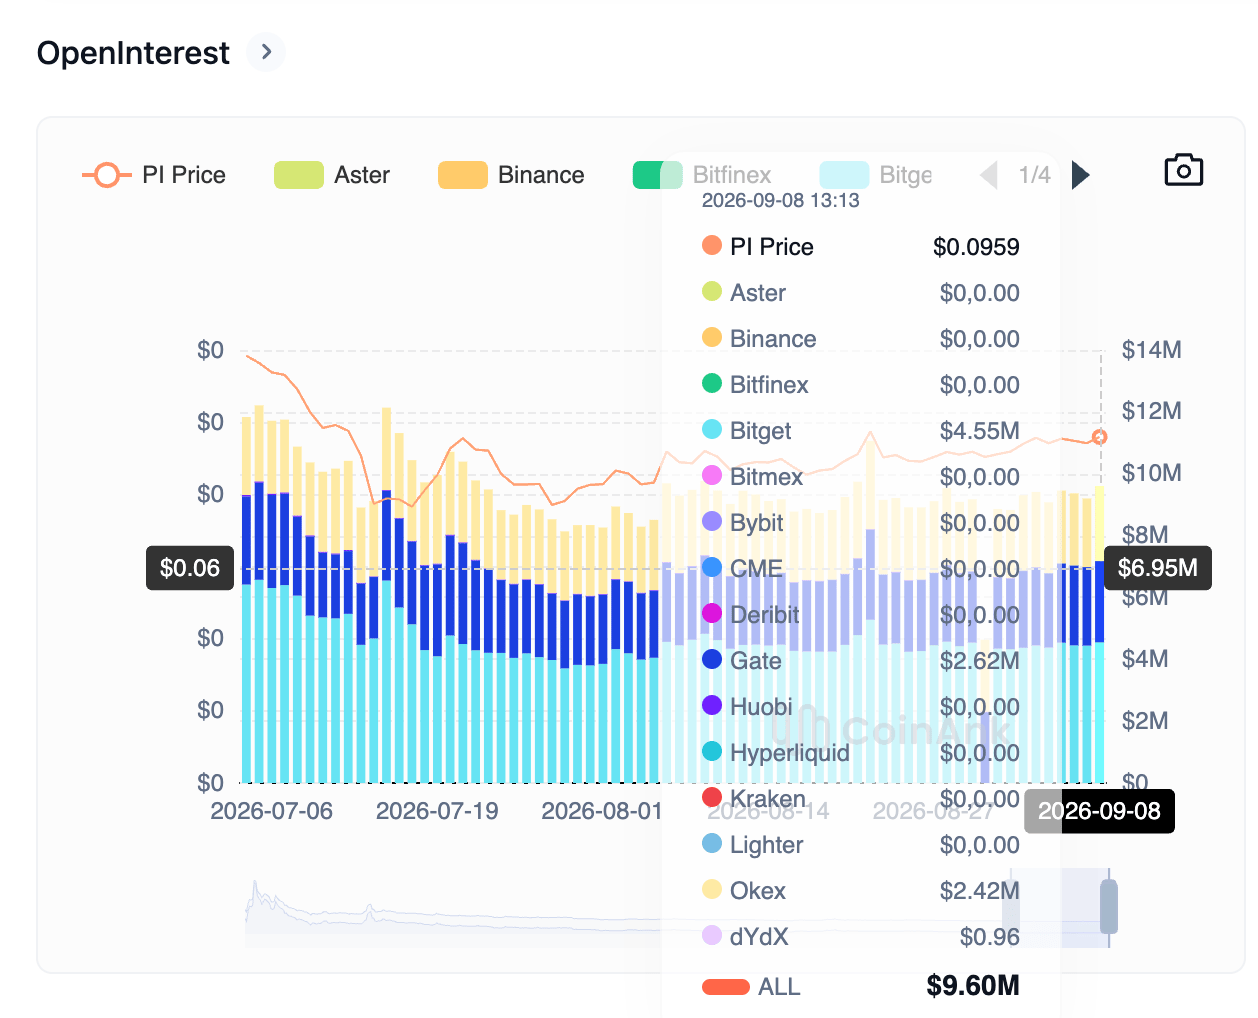
- PI derivatives data points to steady positional buildup with Open Interest holding above $9 million.
- The technical outlook for PI shows a near-term bullish bias, with upside momentum holding firm.
Pi Network (PI) price is up nearly 2% on Tuesday, advancing its modest 5% gains from the previous day. Retail demand holds firms, with steady positional buildup in PI futures. The technical outlook for PI shows near-term upside bias, with bulls targeting a confirmed breakout above $0.0971.
Retail demand shows early signs of recovery
Pi Network futures data suggest retail demand holding firm. According to CoinAnk, the PI futures Open Interest (OI) stands at $9.60 million, up from $9.20 million the previous day, indicating an increase in the notional value of active contracts or fresh positional buildup.
In addition, the recent attempts to boost ecosystem utilities and adoption, such as new Solohost apps, Robopay partnership, the return of OpenPay Cash-in feature and the new developers functionalities support the near-tern optimistic outlook.
Technical outlook: Could PI extend gains above $0.10?
Pi Network trades above $0.0950 at press time on Tuesday, holding a capped near-term tone below the 78.6% Fibonacci retracement of the $0.1341 to $0.0703 downswing at $0.0971 resistance level. The resistance remains intact since mid-July, emerging as a crucial sell wall.
PI holds above the 50-day Exponential Moving Average (EMA) at $0.0940, suggesting some short-term underpinning, but the overhead 100-day and 200-day EMAs roughly $0.1064 and $0.1439, reaffirming the capped tone. The Relative Strength Index (RSI) near 58 on the daily chart hints at improving momentum with an upward slope above the midline.
A confirmed breakout above $0.0971 could target the 100-day EMA at $0.1063, followed by the 78.6% Fibonaci retracement level at $0.1168.
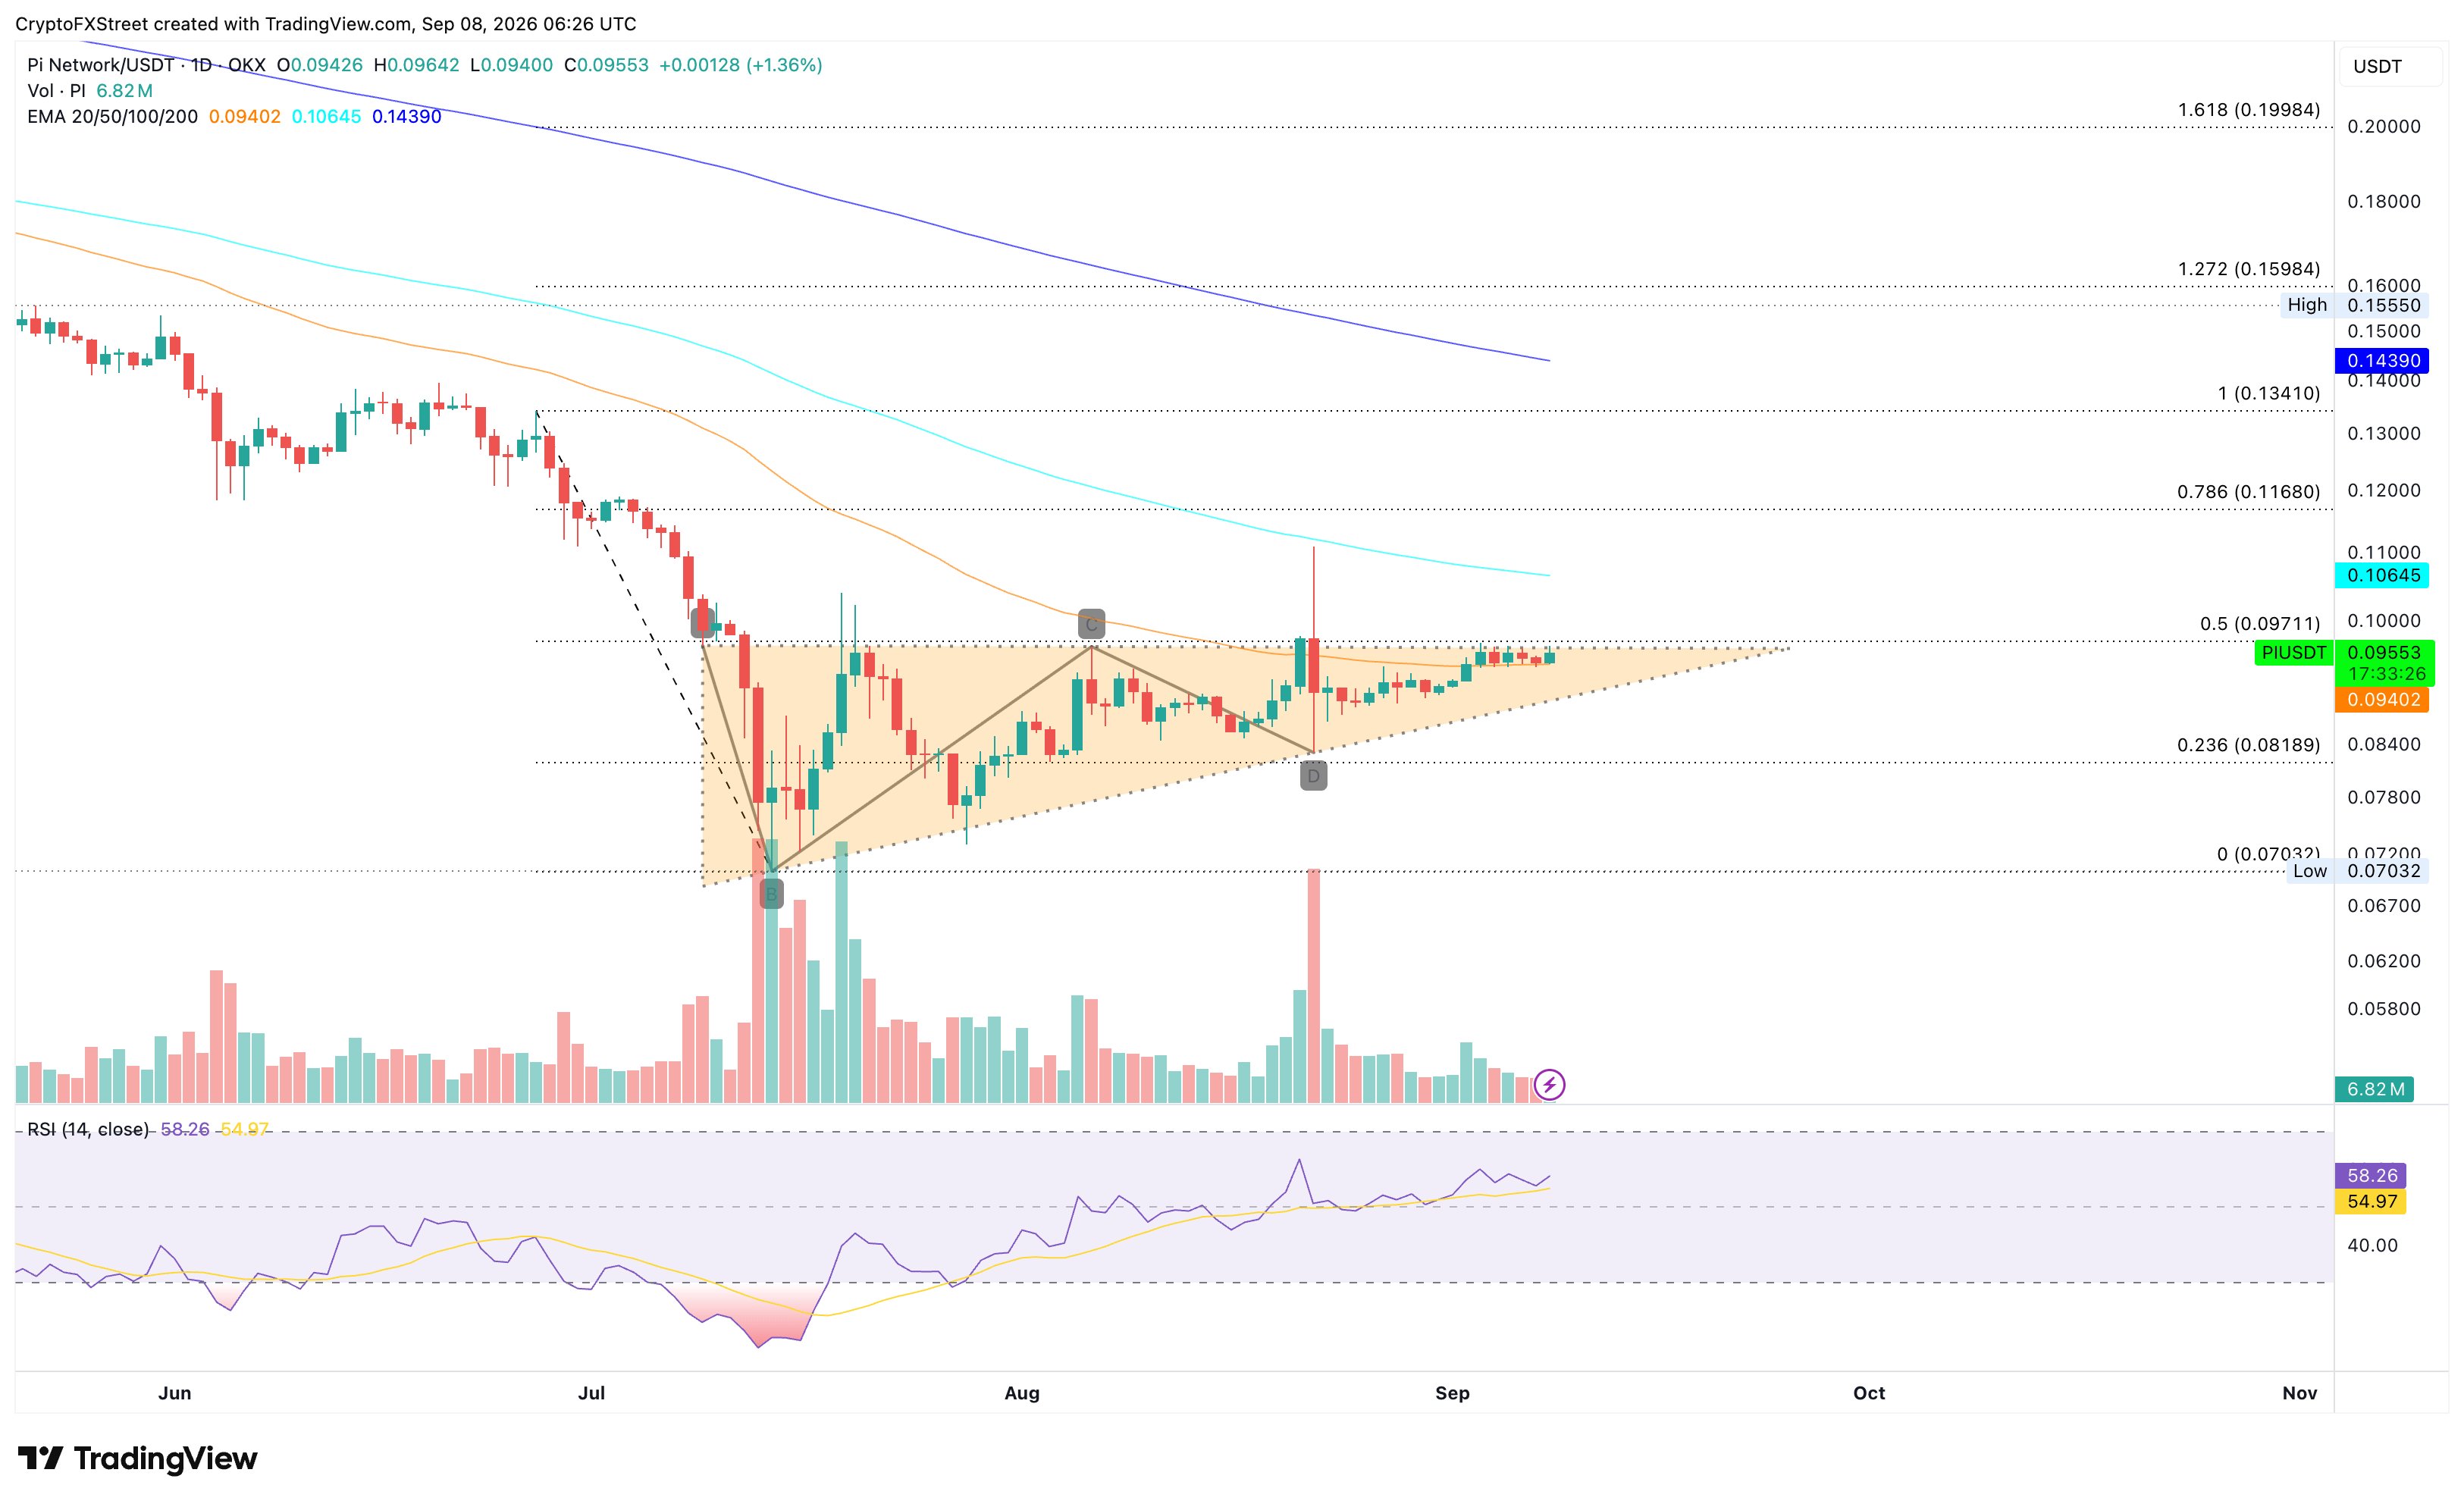
On the downside, the 50-day EMA at approximately $0.0940 offers immediate support. A daily close below this level would expose PI to renewed downside pressure, targeting the 23.6% Fibonacci retracement level at $0.0818.
(The technical analysis of this story was written with the help of an AI tool. Know more.)
Recommended Articles











Comments (0)
Click the $ button, enter the symbol, and select to link a stock, ETF, or other ticker.