


Aptos Price Forecast: APT recovery eyes a breakout rally after crucial blockchain bug fix



- Aptos is up nearly 3% on Thursday, rising after three consecutive days of weakness.
- Ethical hackers helped patch a crucial bug in the Aptos Virtual Machine, which exposed its native TVL of over $108 million.
- Retail activity remains mixed as Open Interest rises even as trading volumes decline, while on-chain transactions show a steady increase.
Aptos (APT) price is up 3% at press time on Thursday after three consecutive days of weakness earlier this week. The recovery is likely linked to a crucial blockchain bug fix that exposed its entire Total Value Locked (TVL) of over $100 million at risk. Despite mixed retail activity with rising Open Interest and declining trading volumes, on-chain transactions continue to advance, indicating steady network demand.
Technically, APT should clear the overhead trendline near $0.6475 and potentially target the 50-day Exponential Moving Average (EMA) at $0.7088.
Crucial bug fix secures over $100 million on Aptos
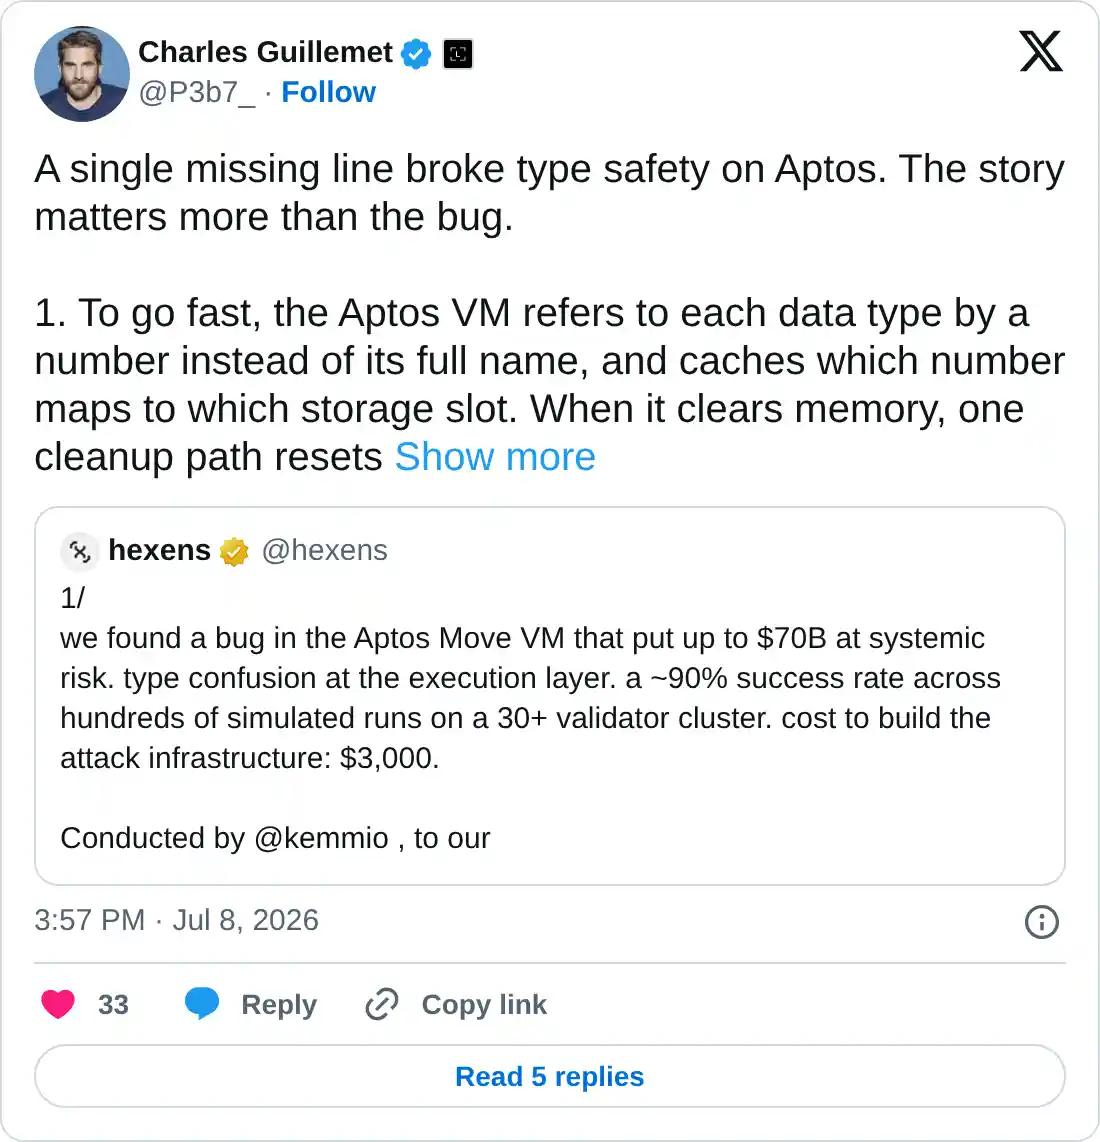
Aptos blockchain patched a crucial bug discovered by ethical hackers on Wednesday, which could have exposed the value of its entire network, over $100 million.
Charles Guillemet, Chief Technical Officer at Ledger, mentioned in his social media post that the vulnerability enabled a multi-block exploit with an almost 90% success rate. In addition, Guillemet stressed that AI has significantly reduced the cost of discovering deep bugs, underscoring the need for base-layer cryptographic guarantees over trusted caches to prevent such systemic risks.
Post-resolution, the APT token shows a minor recovery on Thursday, diverging from most altcoins moving lower.
Network strength and mild retail demand support recovery
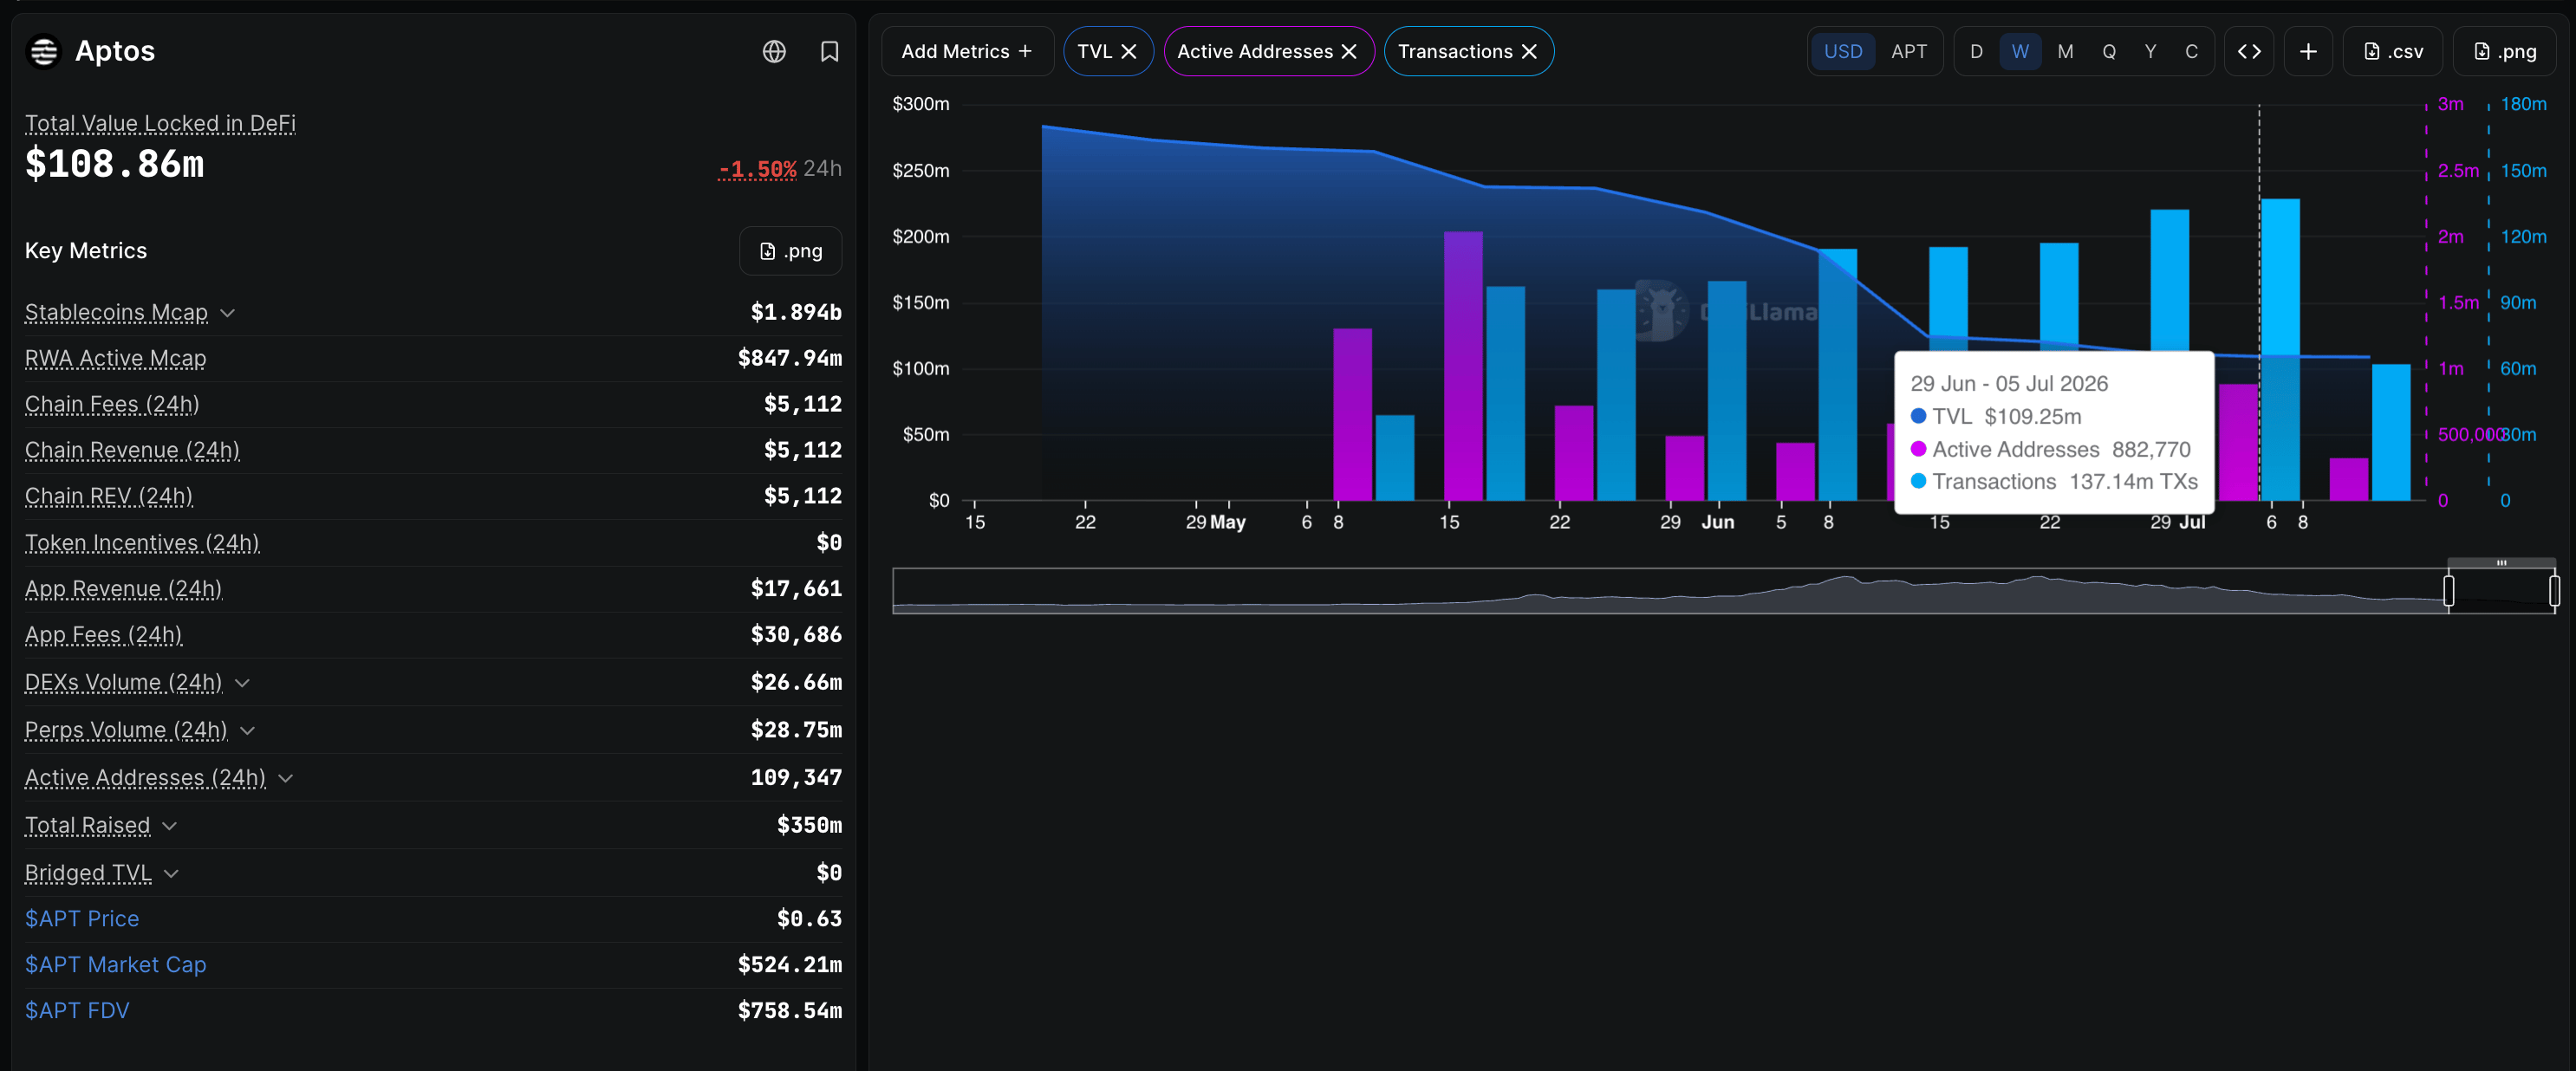
Aptos shows a steady recovery in network strength while retail demand lags. DeFiLlama data show TVL stabilizing above $100 million after a steep outflow from $189 million in early June. At press time, Aptos’ TVL is down 1.50% over the last 24 hours to $108.86 million, while weekly transactions reached 137 million, indicating growth in network activity.
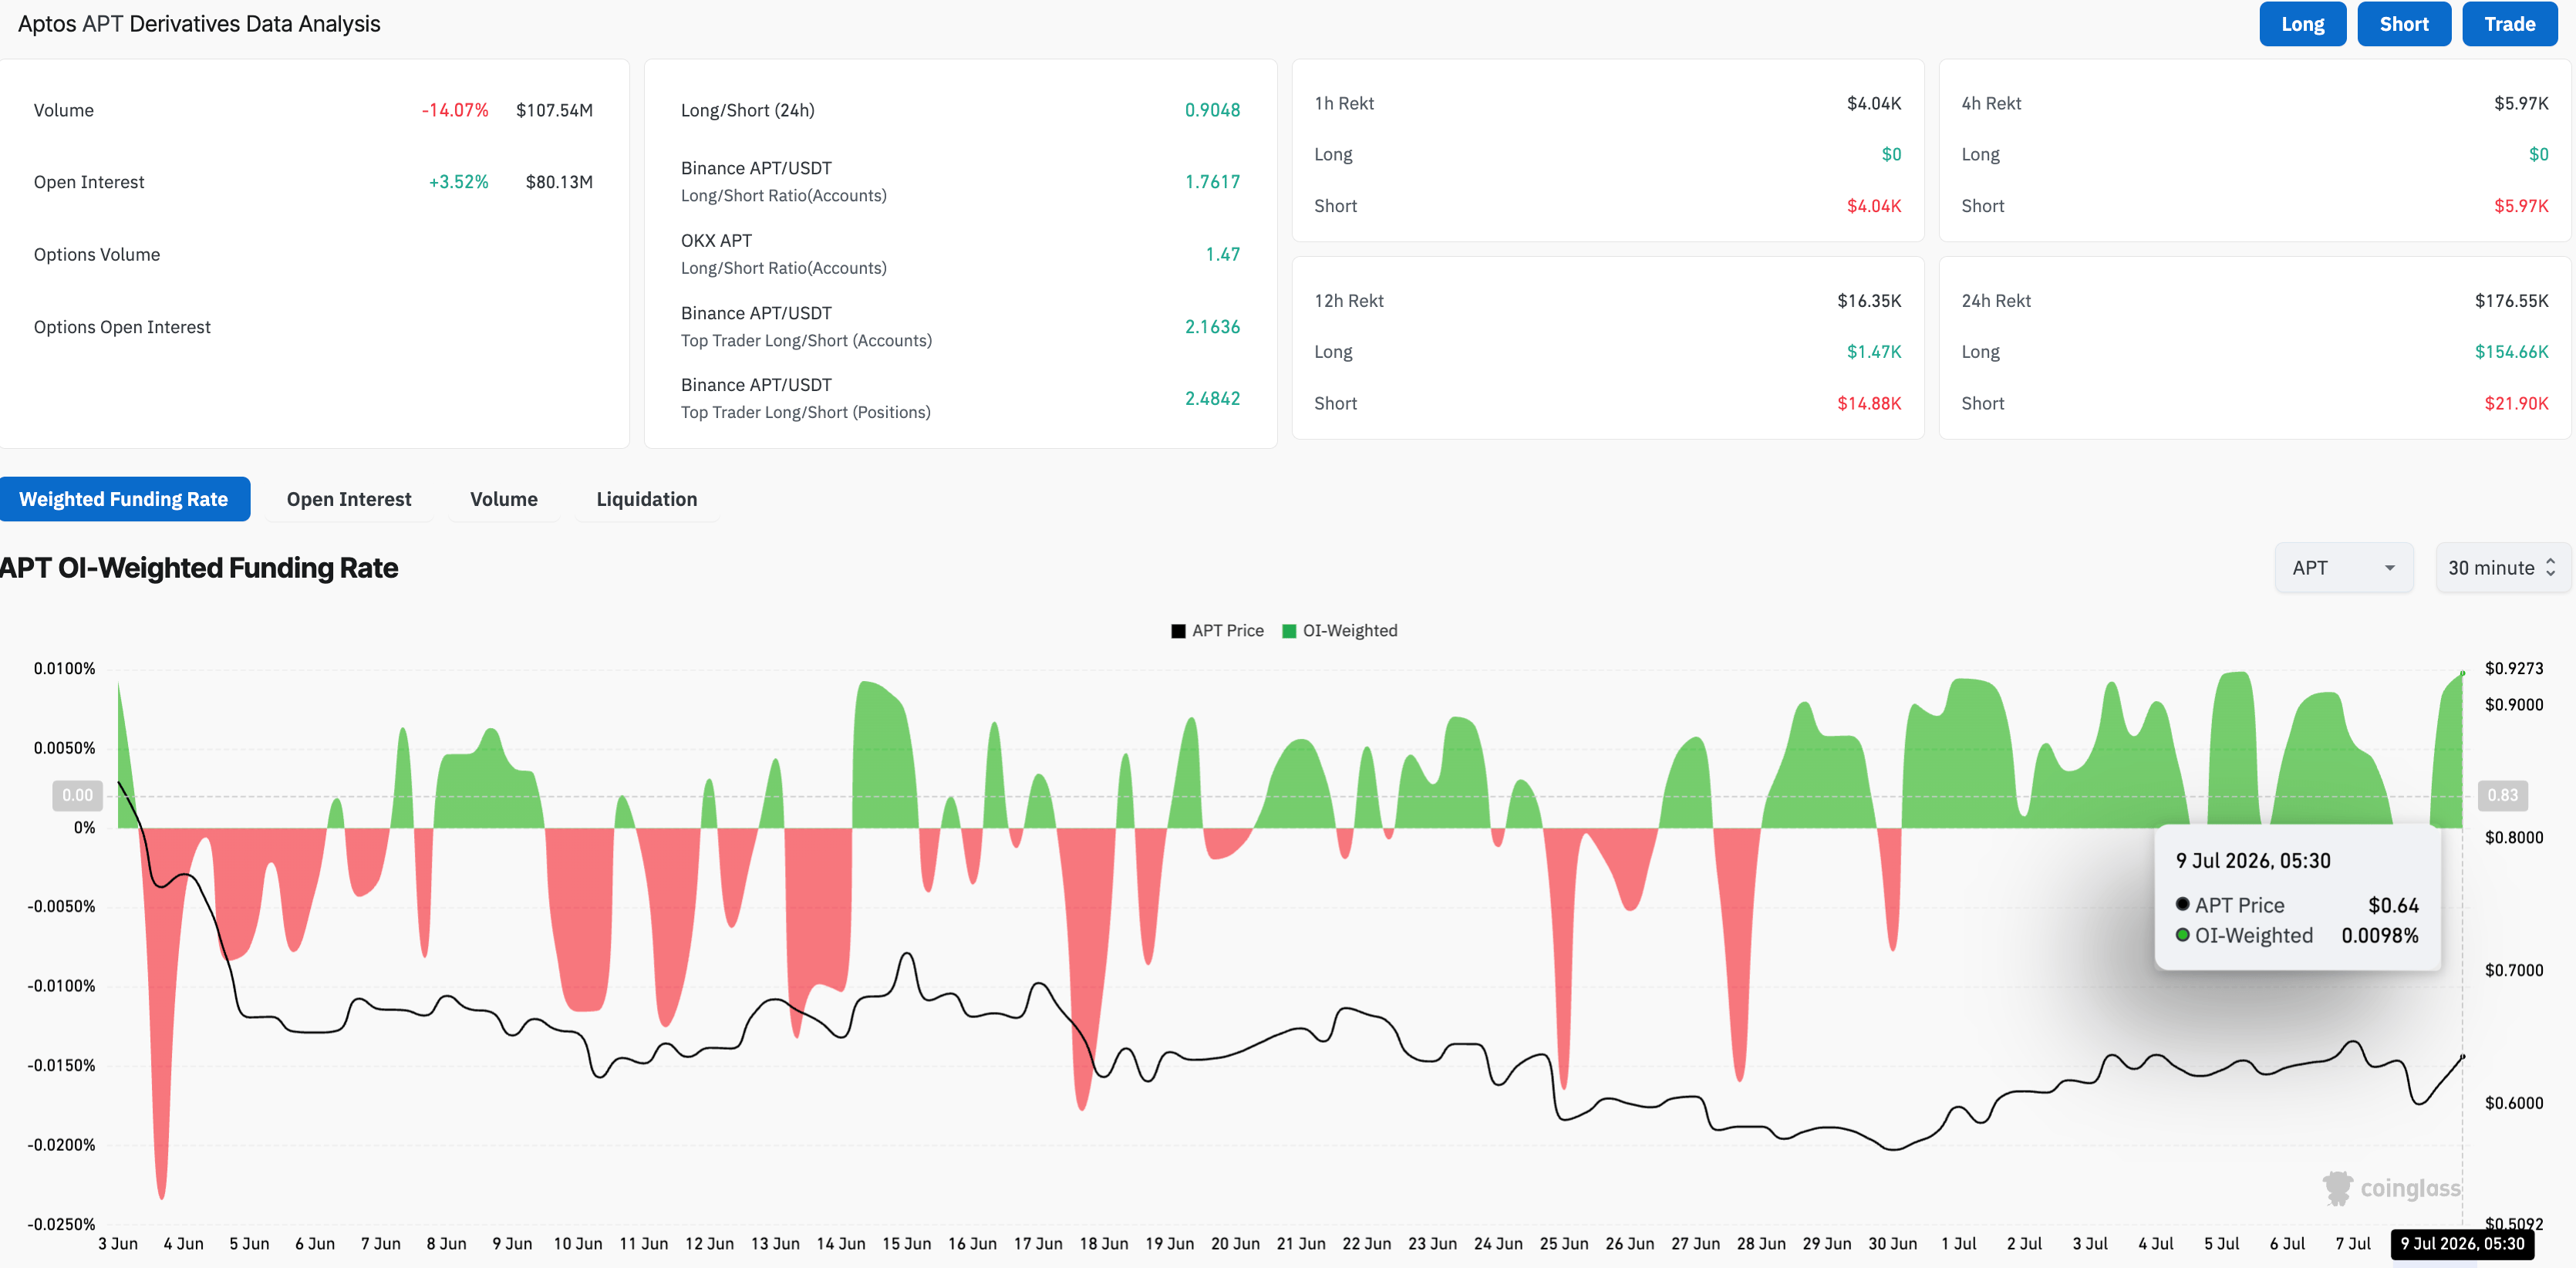
On the retail front, CoinGlass data show that APT futures Open Interest is up over 3% in 24 hours to $80.13 million, indicating a bullish positional buildup, while funding rates at 0.0098% imply that traders are willing to buy long positions at a premium.
However, the volume has dropped by 14% over the same period to $107.54 million, indicating reduced activity. A bullish positional buildup despite declining volumes suggests increased leverage exposure, which could lead to heightened long liquidations if prices reverse to the downside.
Aptos eyes a bullish setup breakout
Aptos is up 3% on Thursday, extending a mild constructive near-term trend despite a broadly bearish structure. APT tests the overhead trendline of a falling channel pattern, near $0.6475, capped below the 50-day and 200-day EMAs at $0.7088 and $1.2883, respectively.
A decisive close above $0.6475 could confirm a breakout from the falling channel, with potential targets including the 50-day EMA at $0.7088, followed by an overhead supply zone between $0.7900 and $0.8070.
The Moving Average Convergence Divergence (MACD) and signal line maintain a weak but upward trend, while the Relative Strength Index (RSI) at 46 rises toward the midline, signaling an ease in selling pressure. Together, the indicators hint at a mild recovery in upward momentum.
Looking down, the key support aligns with the recent swing low from June 30 at $0.5550, followed by the descending support trendline near $0.5350.
(The technical analysis of this story was written with the help of an AI tool. Know more.)
Recommended Articles








Comments (0)
Click the $ button, enter the symbol, and select to link a stock, ETF, or other ticker.