


Pi Network Price Forecast: PI flashes early reversal signals at the last line of defense



- Pi Network edges lower on Tuesday, marking its fourth consecutive day of losses.
- Broader market risk appetite remains weak, limiting the upside potential for altcoins.
- The technical outlook for PI is mildly optimistic, supported by a bullish RSI divergence emerging at a key support level.
Pi Network (PI) is trading near its lowest level at $0.1100 on Tuesday, under intense downside pressure. PI remains vulnerable to steeper corrections, with its fourth straight day of losses amid weak market-wide risk appetite.
Technically, PI hopes for a potential rebound supported by a bullish divergence in the Relative Strength Index (RSI).
Broader market risk-off sentiment weighs down PI token
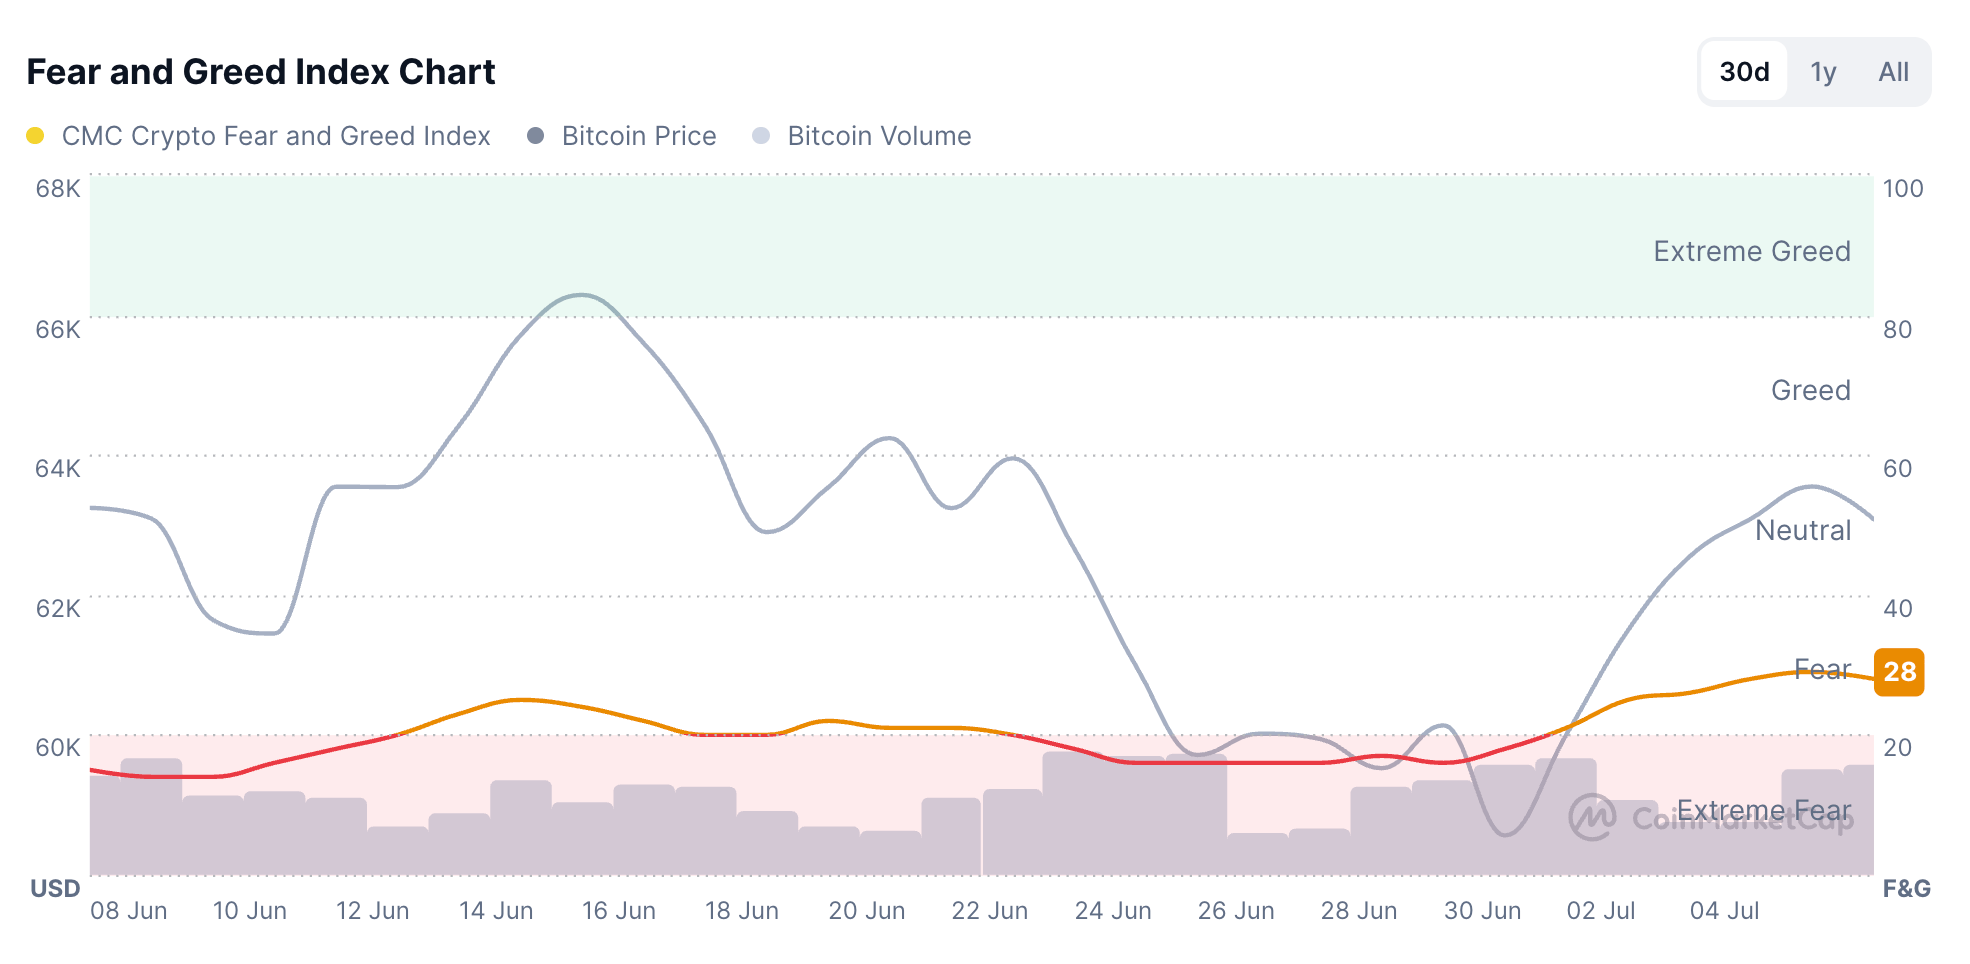
The broader crypto market sentiment remains primarily bearish, with the Fear and Greed Index at 28 on Tuesday, reflecting a sell-side dominance. Although sentiment has recovered from the “Extreme Fear” zone, PI tokens struggle to regain strength, reflecting a lack of reliance on speculative demand.
Will PI token bounce back?
Pi Network holds above $0.1100 at press time on Tuesday amid a broadly bearish trend. From a technical perspective, PI is holding at its last recorded support level of $0.1111 from June 30. A slip below this zone could plunge PI into downside price discovery, potentially targeting the $0.1000 psychological threshold.
That said, the Relative Strength Index (RSI) at 33 on the 4-hour chart indicates a mild bullish divergence relative to the previous bottom on June 30, suggesting a possible rebound ahead. Meanwhile, the Moving Average Convergence Divergence (MACD) indicator sits marginally below its signal line, with a negative histogram contraction, reinforcing a subdued downside momentum profile.
Looking up, a potential rebound could face the 50-period Exponential Moving Average (EMA) at $0.1171 on the 4-hour chart, followed by the 50% retracement level at $0.1220, measured over the downswing from $0.1341 to $0.1111.
(The technical analysis of this story was written with the help of an AI tool. Know more.)
Recommended Articles








Comments (0)
Click the $ button, enter the symbol, and select to link a stock, ETF, or other ticker.