


Pi Network: Steady decline risks a record low despite easing market drag



- Pi Network extends losses on Monday for the third consecutive day, risking a steeper correction to a new record low.
- The long-to-short ratio plunges below 1, suggesting risk-off sentiment among traders.
- The technical outlook for PI is bearish, with selling momentum building despite easing downside pressure in the broader crypto market.
Pi Network (PI) price edges below $0.1150 on Monday, extending its losses for the third straight day. Data shows an intense bearish bias among traders holding short-sided positions, reflecting weak retail support despite easing downside pressure across the crypto market. The technical outlook for PI is bearish, with selling pressure building despite indicators flashing oversold conditions.
Bearish bias persists in PI
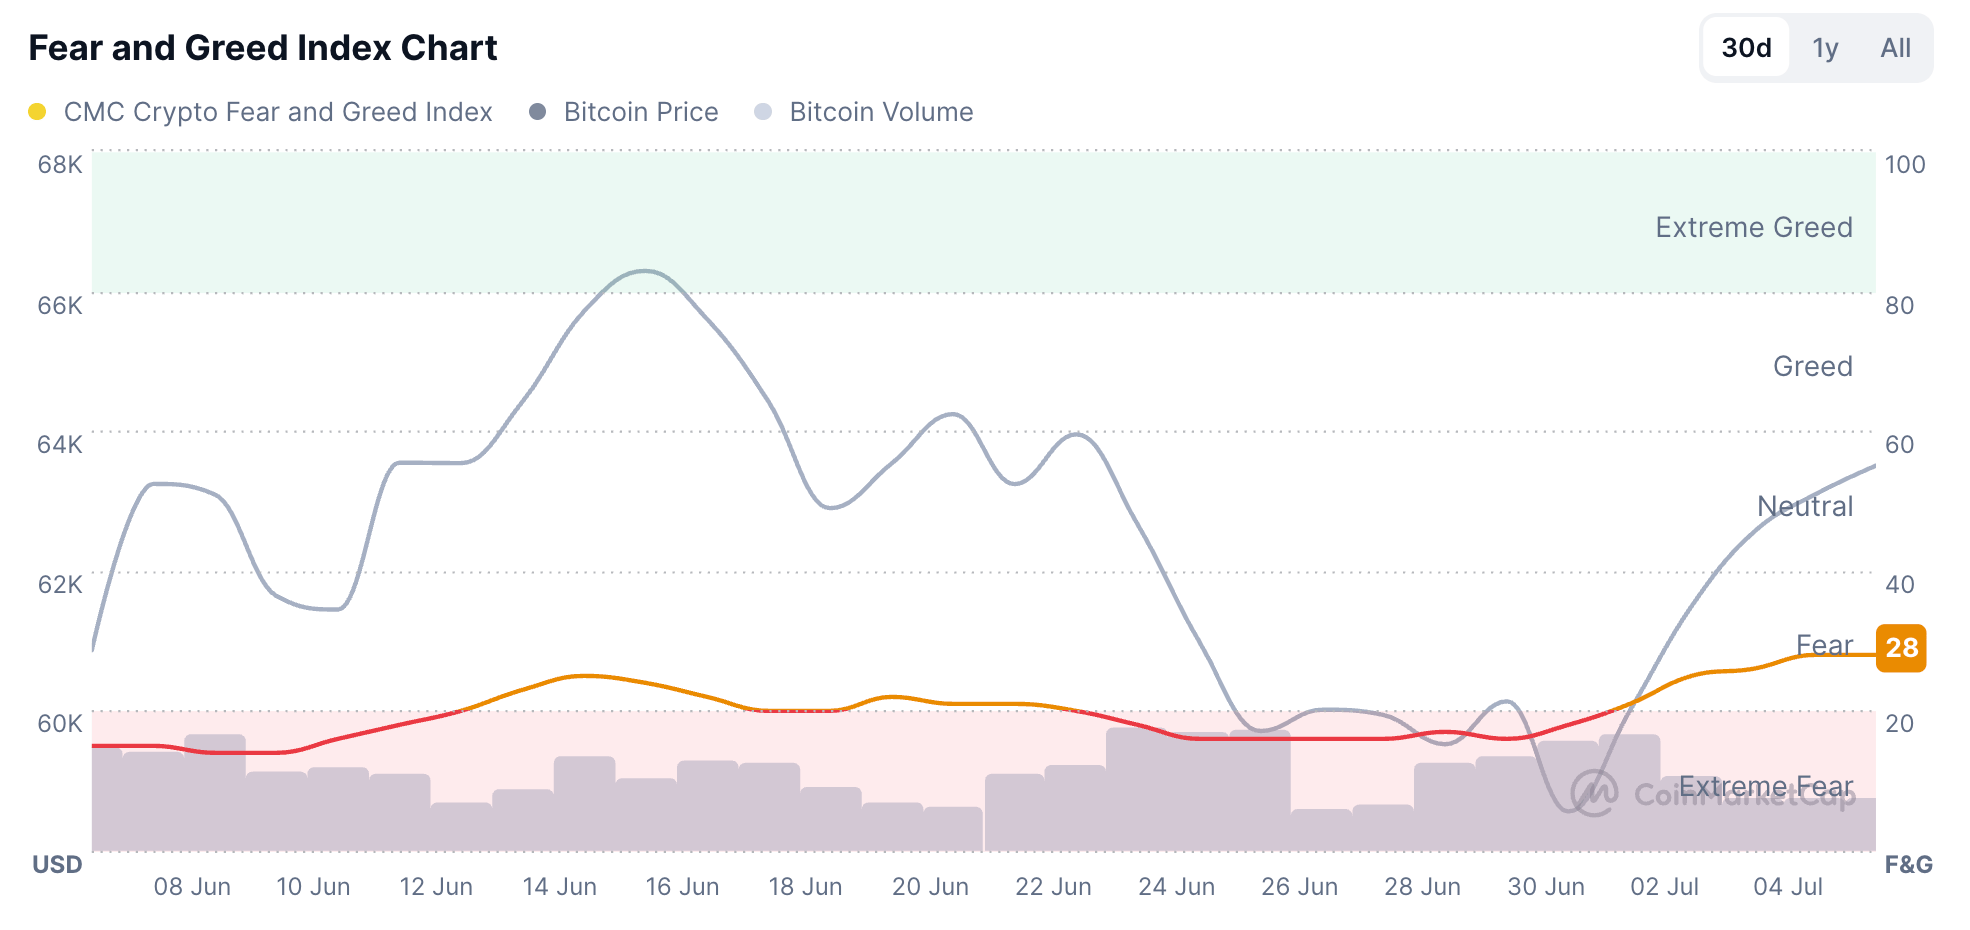
Pi Network struggles to regain retail confidence despite easing of broader market risk-off sentiment. Bitcoin (BTC) shows a recovery to $63,000 on Monday, up from sub-$60,000 levels last week, while the Fear and Greed Index is at 29, up from Extreme Fear levels of 17 during the same period. Taken together, the data reaffirms a broader market recovery.
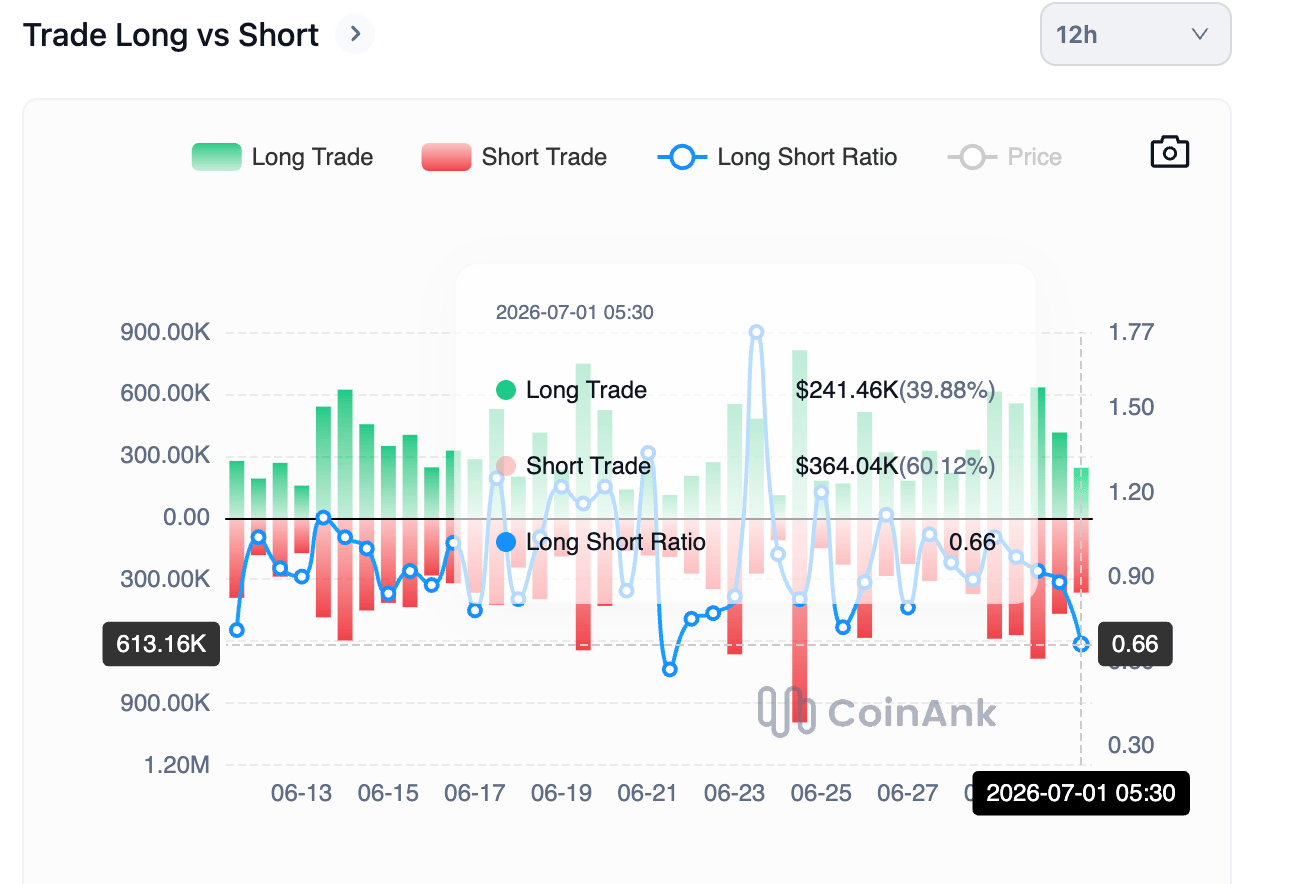
On the retail front, CoinAnk data shows the long-to-short ratio has dropped to 0.66 on Monday, reflecting clear sell-side dominance in positional buildup as traders anticipate further downside. The lack of an immediate catalyst to boost retail demand supports the bearish bias.
Pi Network risks forming a new lower leg
Pi Network extends losses on Monday, maintaining a steady declining under the influence of an overhead resistance trendline, near $0.1278, which continues to cap the broader structure. The 50-day Exponential Moving Average (EMA) at roughly $0.1345 and the 200-day EMA near $0.1793 hold significantly above the price, clear bearish phase, reaffirming the bearish long-term trend.
Momentum conditions on the daily timeframe are weak, as the Moving Average Convergence Divergence (MACD) continues to descend below its signal line in the negative territory. At the same time, the Relative Strength Index (RSI) around 29 hints at oversold conditions despite growing selling momentum.
Looking down, the record low of $0.1111 acts as the immediate support level, where a slip below could risk testing the S1 Pivot Point at $0.1010.
On the topside, initial resistance is seen around the resistance trendline near $0.1278, where sellers could re-emerge on any corrective bounce.
(The technical analysis of this story was written with the help of an AI tool.)
Recommended Articles








Comments (0)
Click the $ button, enter the symbol, and select to link a stock, ETF, or other ticker.