


Stellar Price Forecast: Record stablecoin growth fuels XLM recovery



- Stellar price trades above its 200-day EMA at $0.197 on Friday after rallying more than 14% this week.
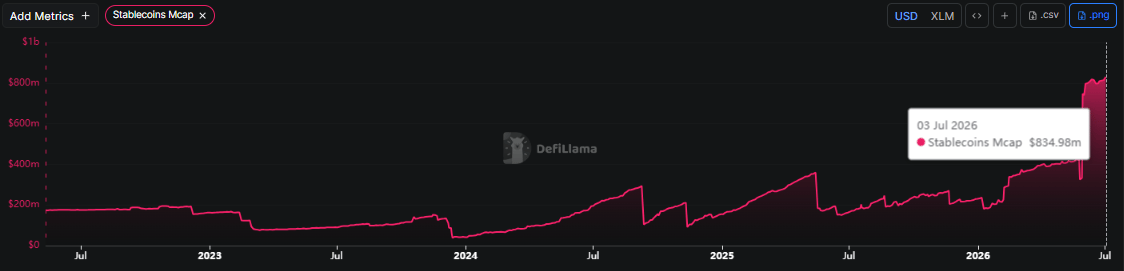
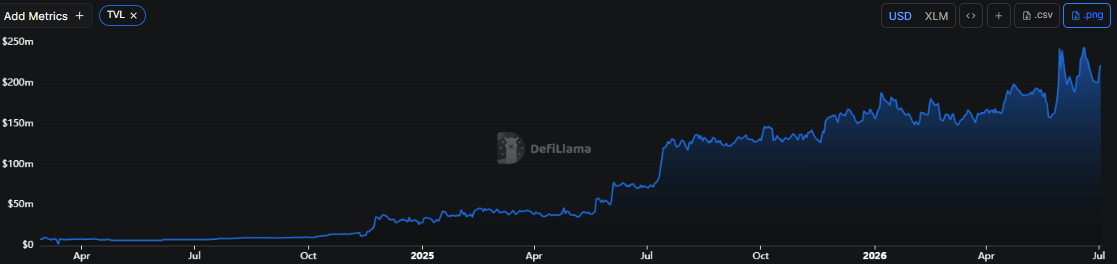
- Record stablecoin market capitalization and rising Total Value Locked signal strengthening on-chain activity.
- Improving momentum indicators and a bullish technical setup suggest XLM could extend its recovery.
Stellar (XLM) price holds above its 200-day Exponential Moving Average (EMA) at $0.197 on Friday after rallying more than 14% this week. The recovery is supported by robust on-chain activity, with Stellar’s stablecoin market capitalization climbing to a record high and TVL continuing to rise. In addition, improving momentum indicators and a strengthening technical outlook suggest XLM could have room to extend its gains.
Strengthening on-chain activity supports a bullish bias
Crypto intelligence tracker DefiLlama data shows that Stellar’s stablecoin market capitalization surged to a record high of 4834.98 million on Friday. This surge indicates continued growth in on-chain liquidity and stablecoin usage, which could support XLM’s long-term price outlook.
In addition, Stellar’s TVL increased from $199 million on Monday to $223 million on Friday, indicating growing activity and interest within the ecosystem. It suggests that more users are depositing or utilizing assets within XLM-based protocols, adding further bullish credence.
Stellar Price Forecast: XLM closes above key 200-day EMA
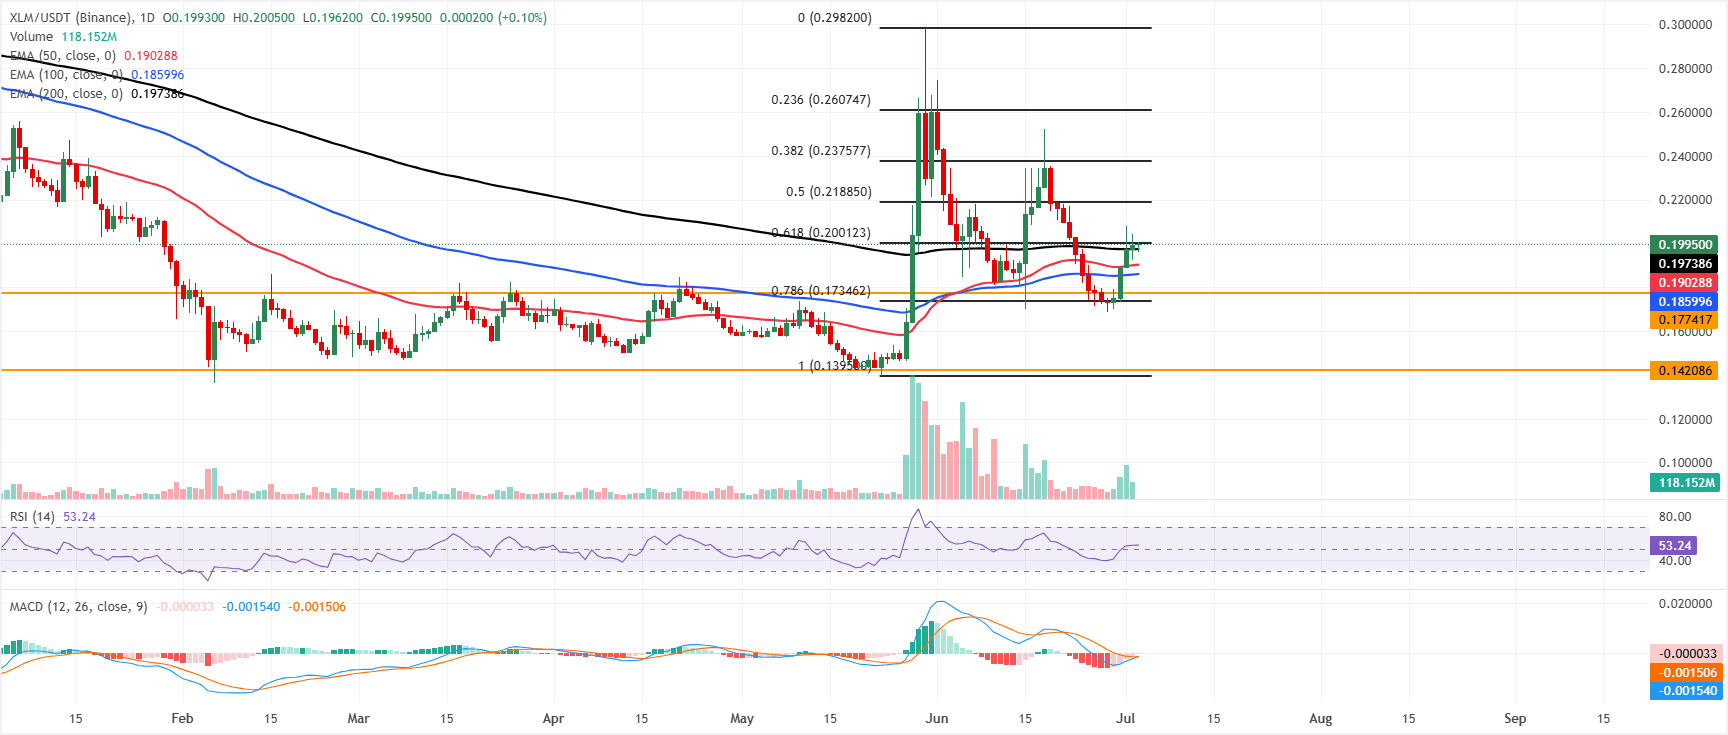
Stellar price trades above $0.199 on Friday, up over 15% so far this week. XLM is holding a modestly bullish near-term bias as price sits above the 50-day, 100-day, and 200-day Exponential Moving Averages (EMAs), which cluster between roughly $0.186 and $0.197, suggesting underlying demand on dips.
The Relative Strength Index (RSI) at about 53 keeps a neutral-to-positive tone, while the Moving Average Convergence Divergence (MACD) indicator hovers around the zero line, hinting at a consolidative phase rather than an impulsive breakout.
On the topside, initial resistance is defined by the 61.8% Fibonacci retracement at $0.200, with further barriers at the 50% retracement near $0.218 and subsequent Fibonacci levels at $0.237 and $0.260.
On the downside, immediate support is seen at the 200-day EMA around $0.197, followed by the 50-day EMA near $0.190 and the 100-day EMA at $0.186; a deeper pullback would expose the horizontal support at $0.177 and the 78.6% Fibonacci retracement at $0.173, ahead of a more distant floor near $0.142.
(The technical analysis of this story was written with the help of an AI tool.)
Recommended Articles








Comments (0)
Click the $ button, enter the symbol, and select to link a stock, ETF, or other ticker.