


Cardano Price Forecast: ADA extends recovery amid subtle bullish retail signs



- Cardano extends gains above $0.1500 on Thursday, following a 6% rebound the previous day.
- Derivatives data signals growing optimism as Open Interest, funding rate, and volume rise over the last 24 hours.
- The technical outlook for ADA is mildly bullish as upside momentum recovers in the short-term.
Cardano (ADA) price extends mild recovery on Thursday after a 6% rebound the previous day, an early signal of a potential bullish trend reversal. Retail demand rises as ADA takes a soft bullish turn after a roughly 40% drop last month, with increases in Open Interest, funding rate, and trading volume. The technical outlook supports a mild recovery in Cardano, with trend momentum rising.
Cardano shows early signs of rebuilding retail strength
Cardano’s price and retail demand dropped sharply last month, starting with its founder Charles Hoskinson’s plan to take a social media break, followed by the 16 million ADA exploitation from its ecosystem project, SecondFi. However, with the short-term broader crypto market recovery linked to Kevin Warsh’s “prices are too high” comment, Cardano took a quick bullish turnaround.
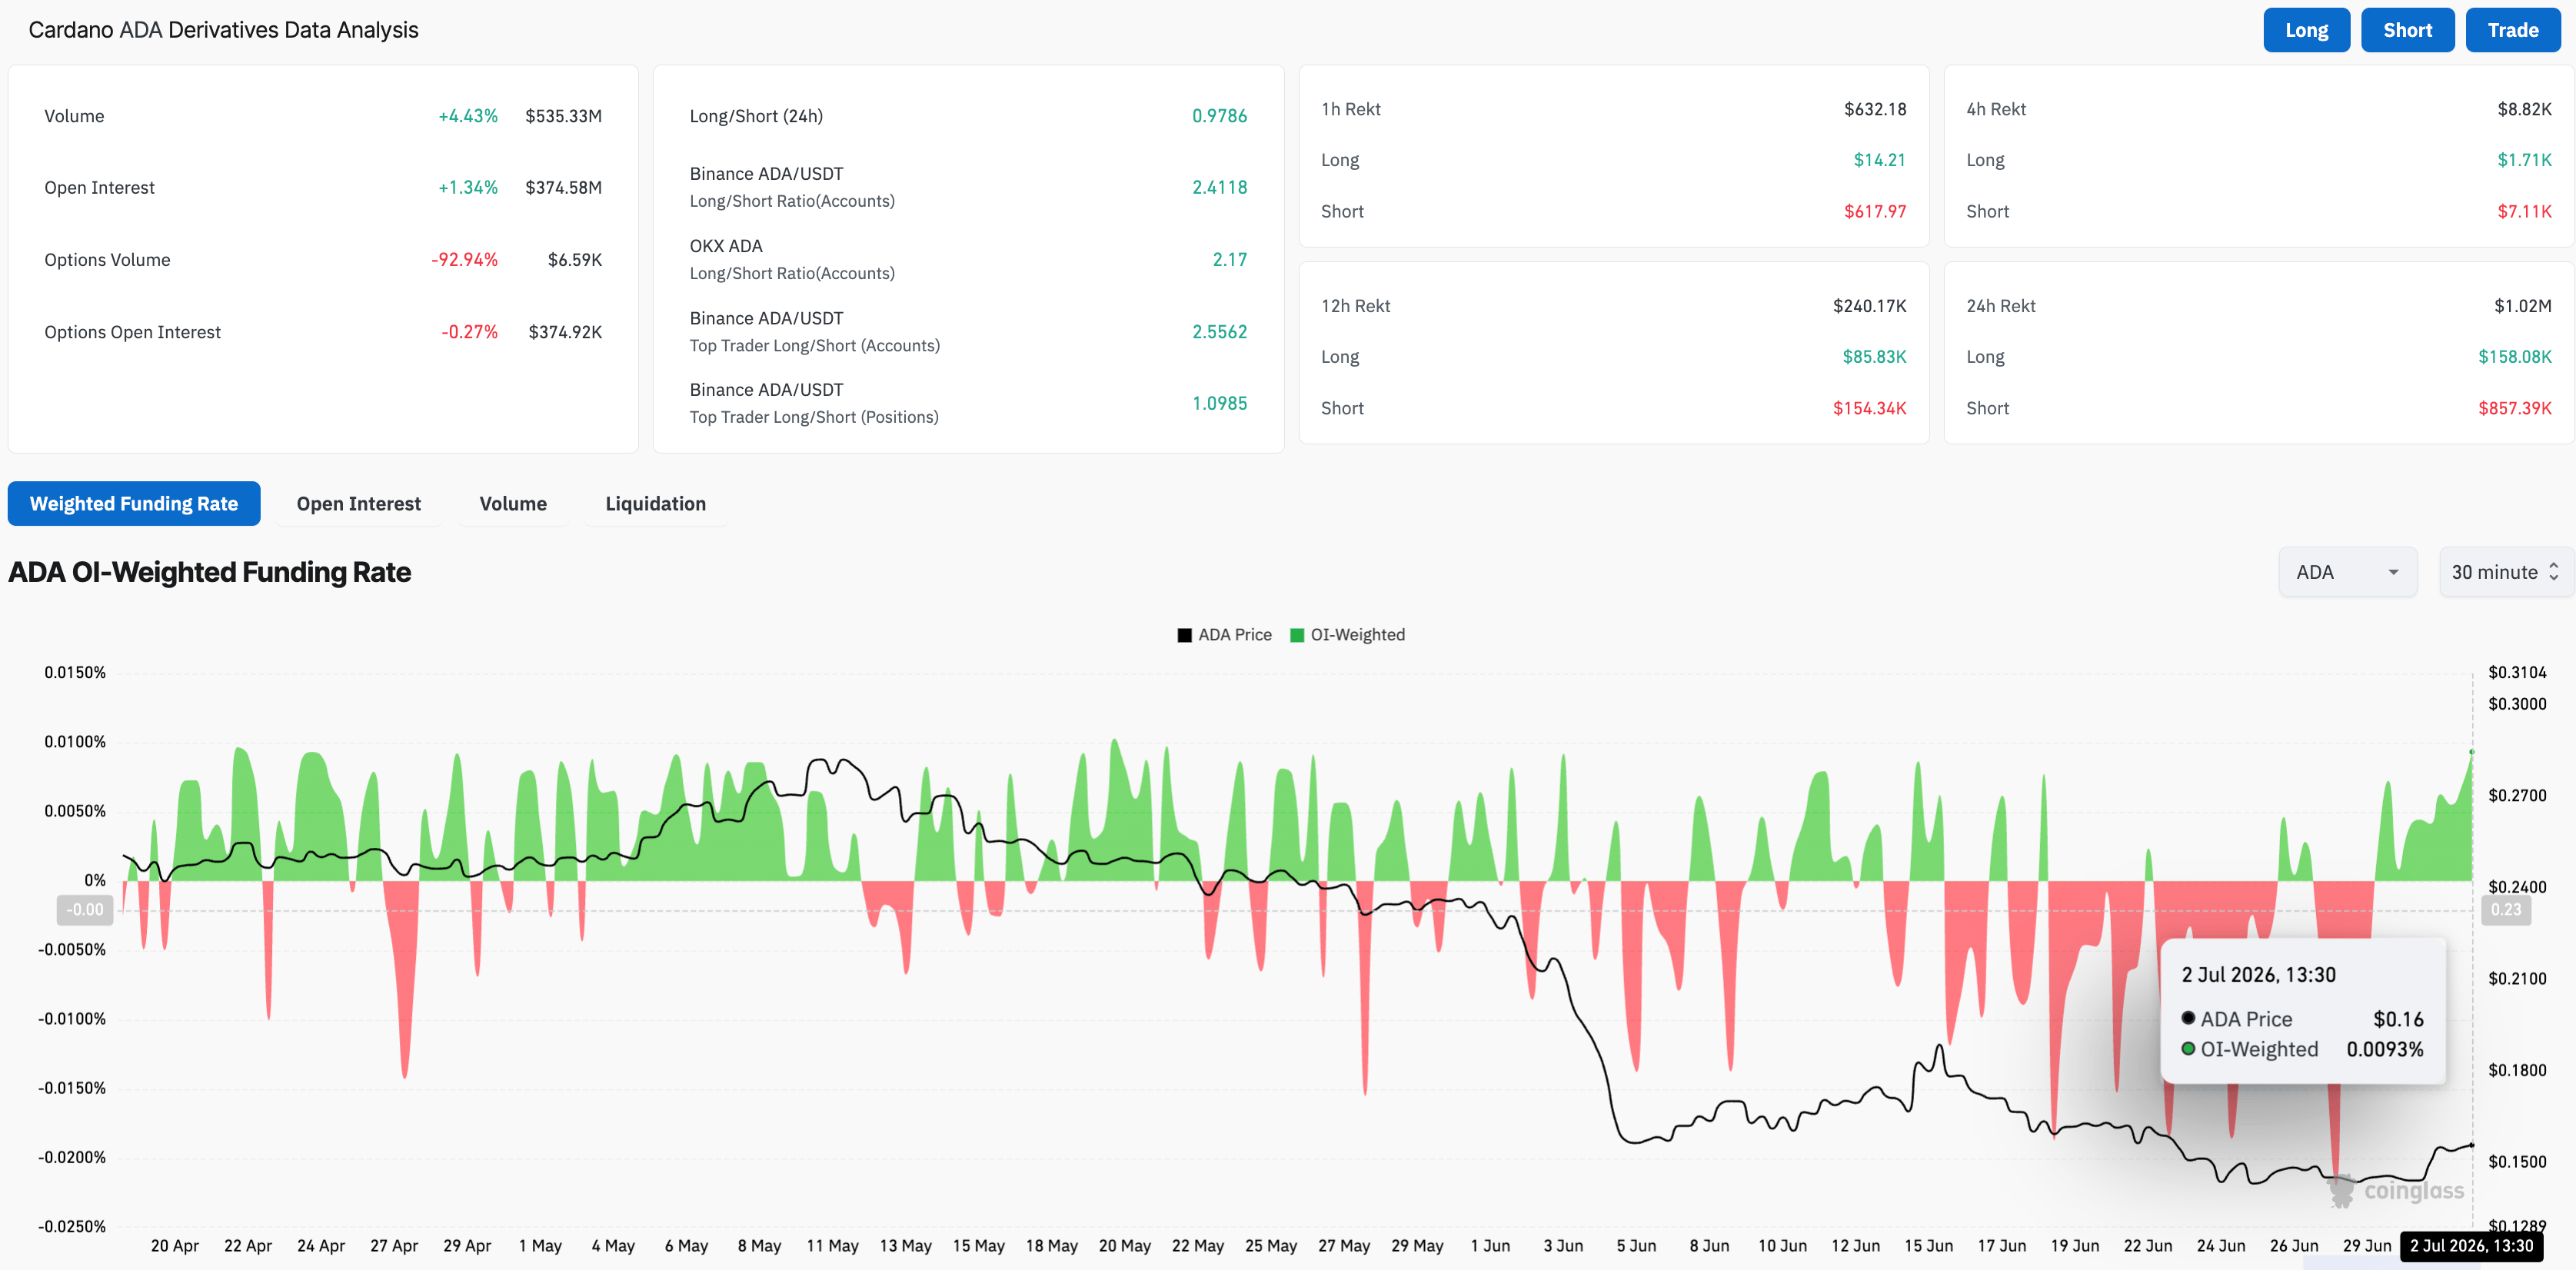
CoinGlass data shows the ADA futures volume increased by over 4% in 24 hours, reaching $535.33 million, reflecting increased trading interest. However, the Open Interest (OI) barely increased by 2%, to $374.58 million, reflecting a largely stable positional buildup.
Still, the positive surge in funding rate to 0.0093% indicates that traders prefer to buy long positions for a premium, anticipating further upside.
Cardano stages a potential bullish trend reversal
Cardano holds above $0.1500 at press time on Thursday, reflecting a short-term recovery amid a broader bearish bias. ADA crosses above the 50-period Exponential Moving Average (EMA) at $0.1501 on the 4-hour chart but remains below the 200-period EMA at $0.1726.
From a technical perspective, ADA heads higher toward the 50% retracement level at $0.1620, measured over the recent downswing from $0.1900 to $0.1382. If ADA clears this zone, it could target the 200-period EMA at $0.1726, followed by the 78.6% Fibonacci retracement at $0.1774.
The Relative Strength Index (RSI) on the 4-hour chart at 66 shows heightened buying pressure, approaching overbought territory. At the same time, the Moving Average Convergence Divergence (MACD) maintains a positive slope above its signal with a constructive histogram, which hints at strong but potentially stretched upside momentum.
On the downside, immediate support sits at the 50-period EMA at $0.1501, reinforced by the 23.6% Fibonacci level at $0.1289. A deeper pullback would expose the structural Fibonacci anchor at $0.1382, with the horizontal support at $0.1000 remaining a more distant bearish objective if selling pressure resumes.
(The technical analysis of this story was written with the help of an AI tool.)
Recommended Articles








Comments (0)
Click the $ button, enter the symbol, and select to link a stock, ETF, or other ticker.