


Hyperliquid Price Forecast: Easing ETF flows, retail demand edge HYPE to make-or-break stage



- Hyperliquid edges higher on Thursday after two consecutive days of losses.
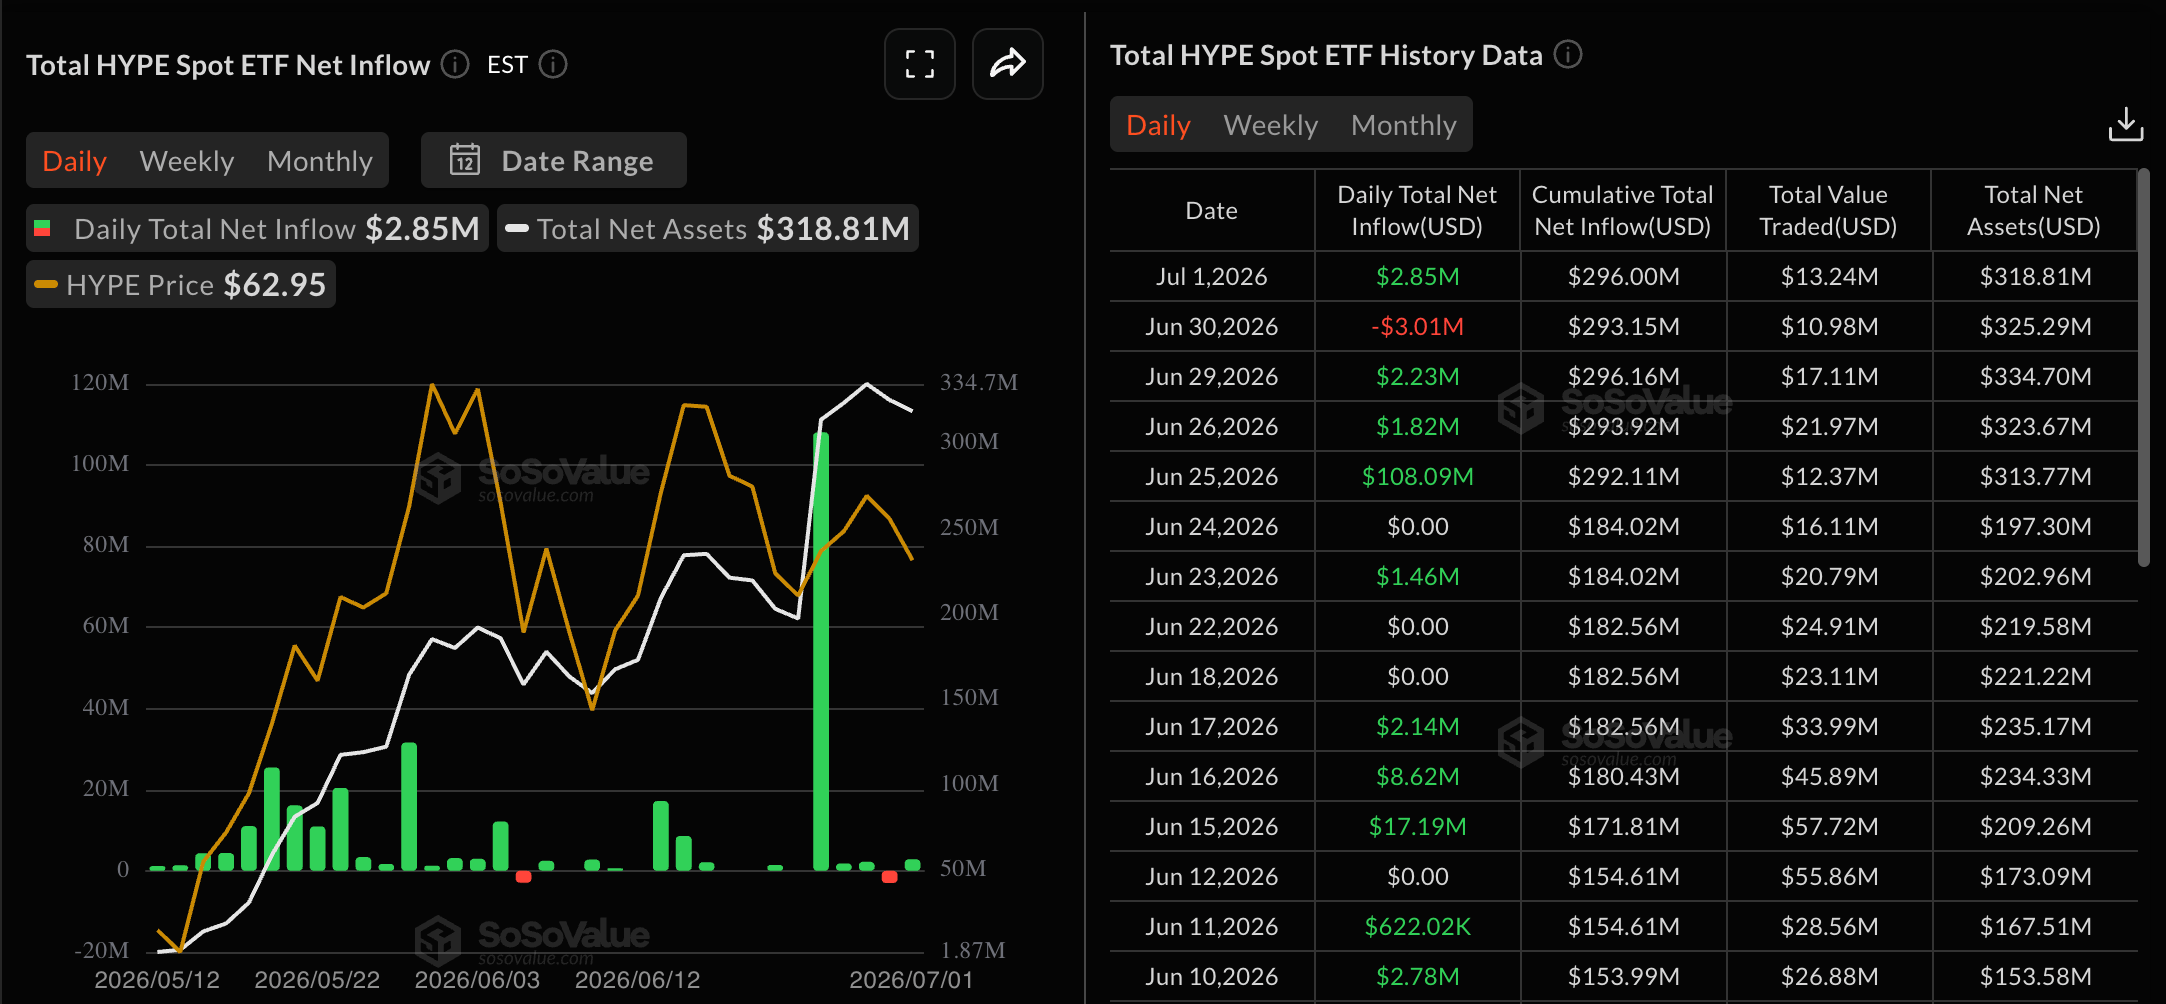
- Mild ETF inflows of $2.85 million on Wednesday suggest easing institutional demand after the $108 million inflow on June 25.
- Derivatives signal increased volatility among traders, with Open Interest declining amid fluctuating funding rates and rising volume.
Hyperliquid (HYPE) price continues to coil, struggling to find direction as it edges higher on Thursday after two consecutive days of losses. Institutional demand, a key driver for altcoins in recent times, eases for HYPE with minimal inflows following a $108 million surge last week. Easing retail demand doubles down on HYPE as Open Interest declines 4% in 24 hours amid fluctuating funding rates.
Institutional and retail demand at ease
Hyperliquid consolidates with a mild sideways contraction, facing headwinds after a record high of around $76.93 in mid-June. The consolidation aligns with the easing of inflows into HYPE-focused Exchange-Traded Funds (ETFs).
Data shows that, apart from the $108 million in inflows on June 25, HYPE ETFs largely recorded daily inflows of less than $10 million. In addition, the $2.85 million in inflows on Wednesday marks a positive start to the month.
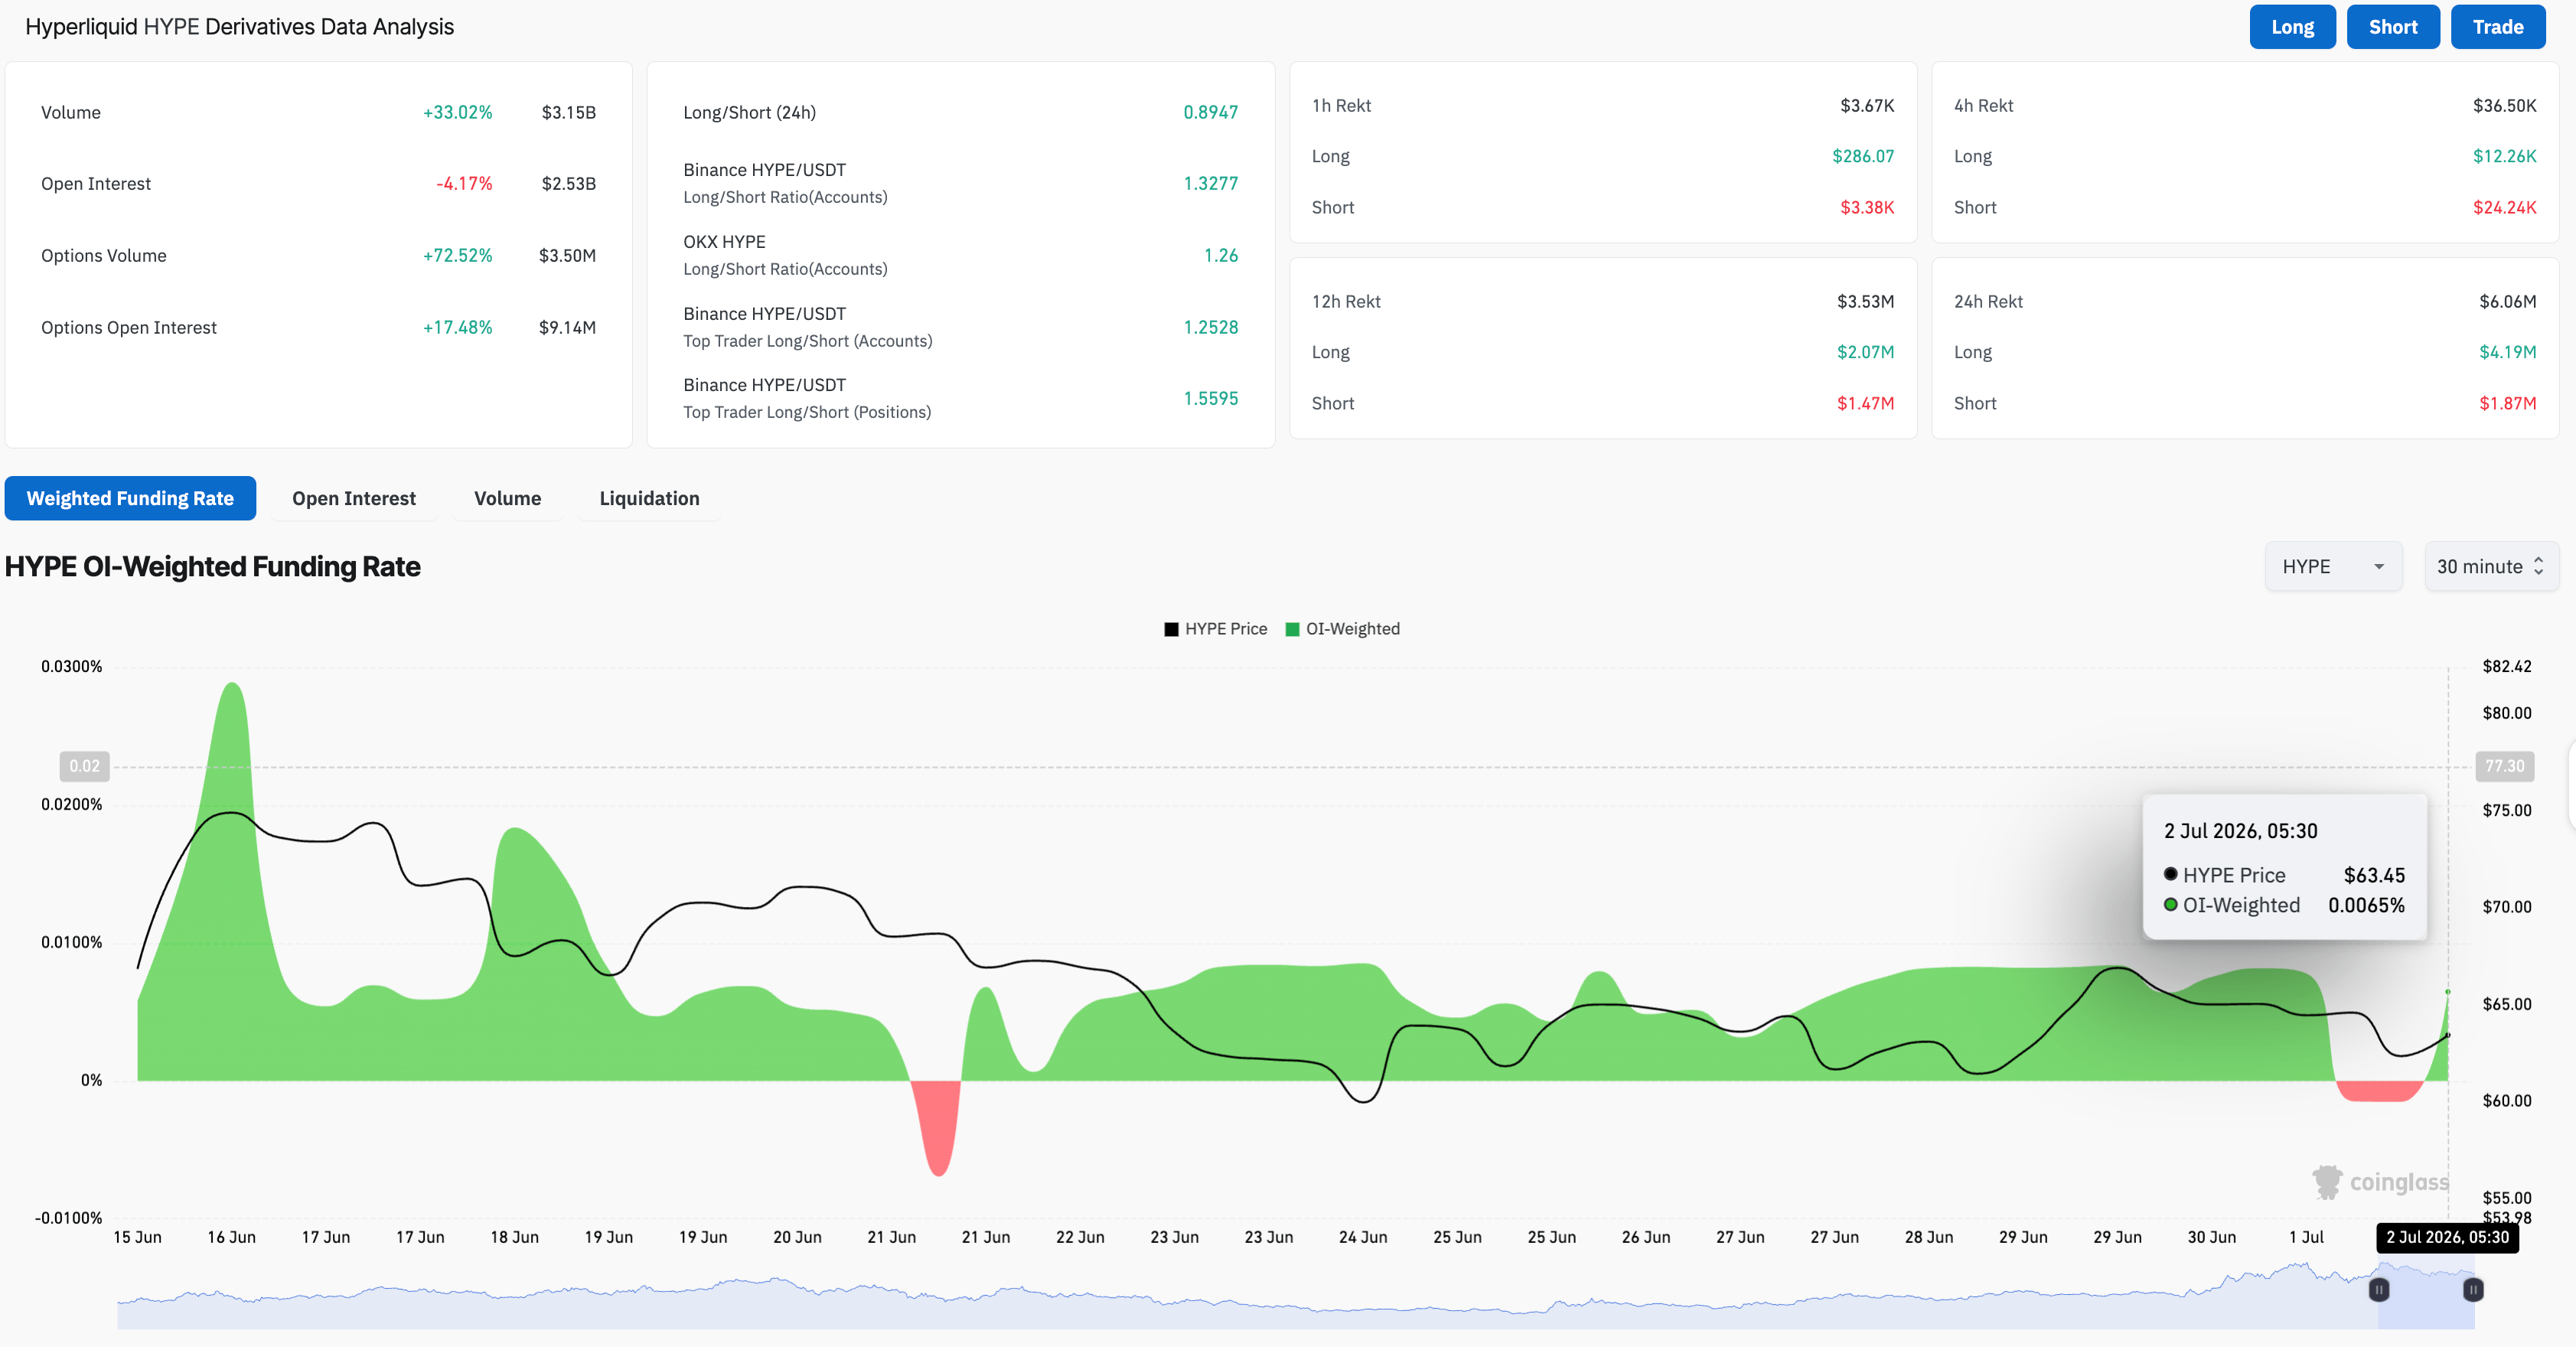
On the retail front, CoinGlass data show the HYPE futures Open Interest (OI) is down 4% over the past 24 hours to $2.53 billion, reflecting a minor positional wipeout, typically associated with risk-off sentiment among traders.
During the same period, a surge in long liquidations of $4.19 million, outpacing short liquidations of $1.87 million, reinforces the bearish bias. However, the 33% rise in volume and a spike in the funding rate to 0.0065% reflect optimism among traders as the price recovers in the short term.
Could Hyperliquid extend its rally?
Hyperliquid hovers above $60 on Thursday, holding a constructive bullish bias above its 50-day Exponential Moving Average (EMA) at $60.28 and the 200-day EMA at $46.28. From a technical perspective, price contracts between two converging trendlines, projecting a minor symmetrical triangle pattern on the daily chart.
The overhead trendline near the 78.6% Fibonacci retracement level at $66.22, measured from the $38.17 to $76.93 upswing, emerges as the immediate barrier. If HYPE clears this barrier, the recovery could extend toward the previous swing high of $76.93, followed by the 127.2% Fibonacci extension level at $93.08.
The Moving Average Convergence Divergence (MACD) falls below the signal line, suggesting easing buying pressure. Meanwhile, the Relative Strength Index (RSI) around 50 points to neutral momentum and hints that bulls may need fresh impetus to extend gains.
Looking down, the rising trendline support around $62.43, close to the 50-day EMA at $60.28, suggests underlying demand after the recent pullback. A slip below the short-term EMA could extend the decline toward the 50% retracement at $54.19, then the 200-day EMA at $46.28.
(The technical analysis of this story was written with the help of an AI tool.)
Recommended Articles








Comments (0)
Click the $ button, enter the symbol, and select to link a stock, ETF, or other ticker.