検索
Bitcoin Intraday: below its lower Bollinger band
Mar 3, 2026 9:42 AM
the downside prevails as long as 67800 is resistance.
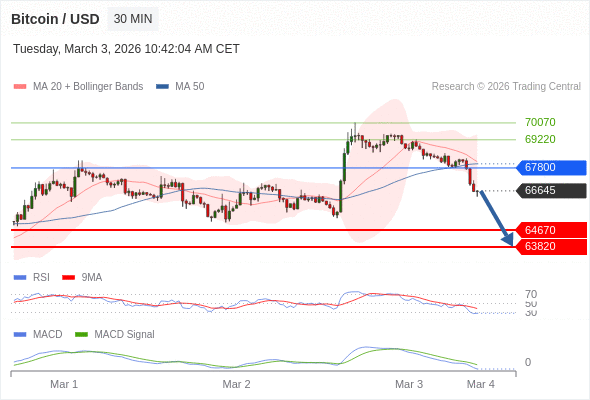
67800 is our pivot point.
Our preference:
the downside prevails as long as 67800 is resistance.
Alternative scenario:
above 67800, look for 69220 and 70070.
Comment:
the RSI is trading below 30. This could mean that either the price is in a lasting downtrend or just oversold and that therefore a rebound could shape (look for bullish divergence in this case). The MACD is below its signal line and negative. The configuration is negative. Moreover, the price stands below its 20 and 50 period moving average (respectively at 68120 and 68009). Finally, the Bitcoin / Dollar has penetrated its lower Bollinger band (66755).
Supports and resistances:
70070 **
69220 *
67800 **
67240
66645 last
64670
63820 **
62980 *
62130 **
Our preference:
the downside prevails as long as 67800 is resistance.
Alternative scenario:
above 67800, look for 69220 and 70070.
Comment:
the RSI is trading below 30. This could mean that either the price is in a lasting downtrend or just oversold and that therefore a rebound could shape (look for bullish divergence in this case). The MACD is below its signal line and negative. The configuration is negative. Moreover, the price stands below its 20 and 50 period moving average (respectively at 68120 and 68009). Finally, the Bitcoin / Dollar has penetrated its lower Bollinger band (66755).
Supports and resistances:
70070 **
69220 *
67800 **
67240
66645 last
64670
63820 **
62980 *
62130 **
免責事項:当コンテンツ(分析・戦略等)は第三者機関Trading Centralが提供するもので、分析官の独立した見解に基づきます。投資家の財務状況や投資目的は考慮されておりません。全ての戦略的見解は投資助言ではなく、参考情報としてのみ提供されます。当社はその正確性を保証せず、戦略実施による結果について一切の責任を負いません。