


 Discount


Walmart Earnings Today: Can WMT Break Its Three-Report Losing Streak Above $125.10?



AI Podcast


Walmart reports fiscal third-quarter results on Thursday, November 19, amid high expectations following Target’s strong performance. Despite beating EPS estimates previously, Walmart shares fell after the last three reports due to soft comparable sales and cautious guidance. Analysts expect U.S. comparable sales to rise 2.8% to 2.9%. Trading at a valuation near 44.9 times forward EPS, the stock leaves little room for disappointment. Key metrics to watch include comparable sales exceeding 3%, operating margins impacted by tariff refunds and fuel costs, and potential full-year guidance upgrades. Technically, the stock remains in a rising channel, with $125.10 serving as critical support and $131.86 as resistance.
TradingKey - Walmart (NASDAQ: WMT) reports fiscal third-quarter results before the US market opens today, Thursday, November 19, with the release due around 7:00 a.m. ET and the call an hour later. The stock closed at $127.36 on Wednesday, November 18, down 0.13%, and premarket quotes are slightly lower at $126.76.
Options traders are pricing a move of about 6.4% in either direction, according to Admiral Markets. On Wednesday's close, that is roughly $8.15, a range of about $119.21 to $135.51, and the top of it sits just above the 52-week high of $135.16. The stock has already rebounded about 28% from its 52-week low of $99.68, so it goes into the report with a lot of the recovery already priced in.
Three Reports, Three Selloffs
Walmart has met or beaten analysts' EPS estimates in each of its last four quarters, according to the Motley Fool, yet the stock has fallen after each of the last three reports. It rose 6.5% after the November 2025 report, then slipped about 1.4% in February, fell about 7.3% in May and dropped 9.15% in August, according to Admiral Markets.
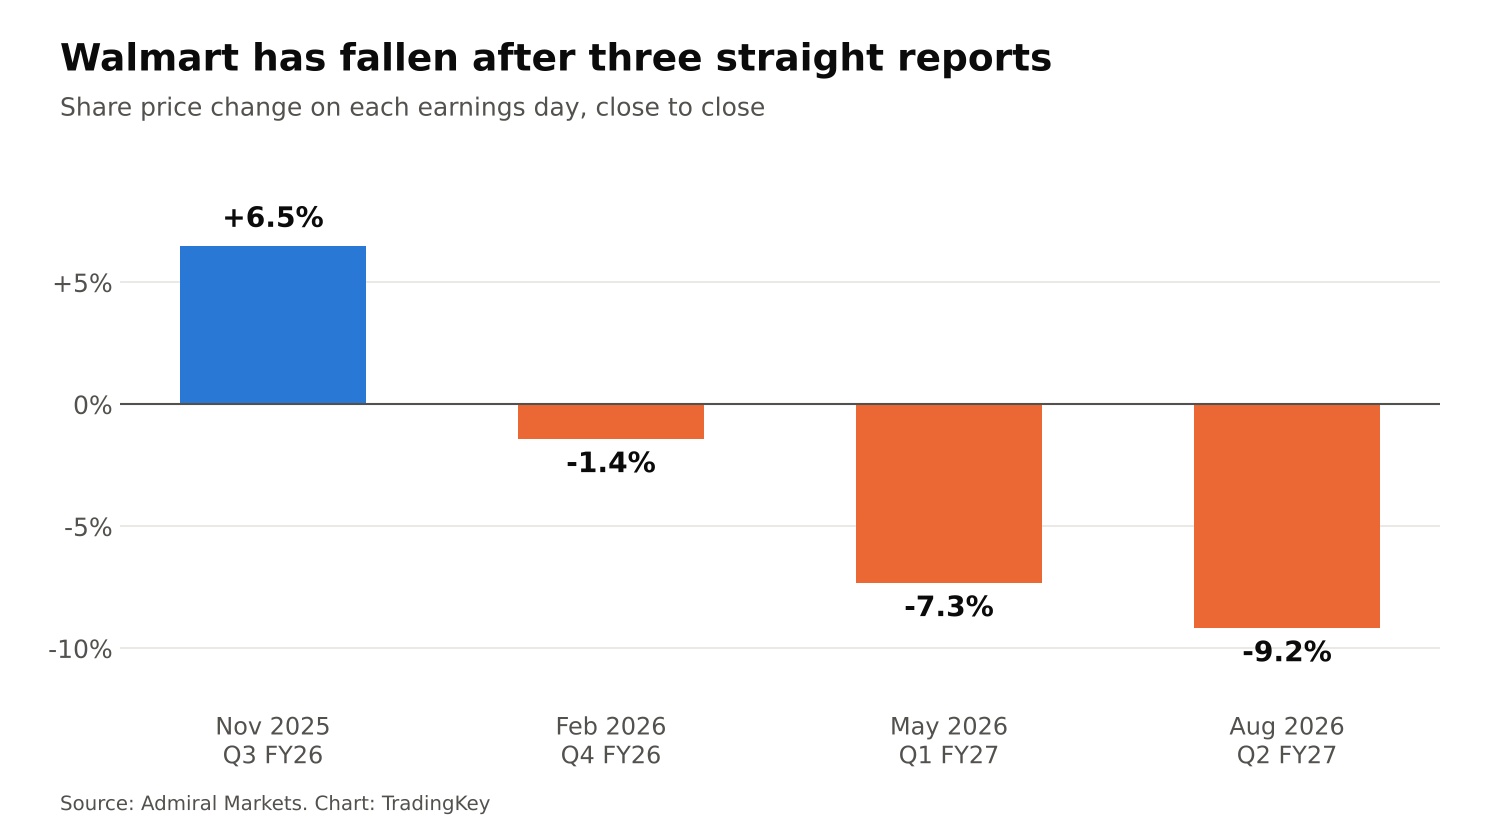
Walmart Share Price Moves on Earnings Days - Source: Admiral Markets
The reasons were similar each time. In May, the quarter was in line, but management warned that higher gasoline prices could pressure consumer spending. In August, adjusted EPS of $0.81 beat the $0.74 forecast, but Walmart US comparable sales rose only 2.6%, against about 3.5% expected, and the third-quarter outlook looked soft. Comparable sales compare stores and digital channels open at least a year, so they show demand without the effect of new stores.
That history means the EPS line alone is unlikely to decide today's move. Investors will focus on comparable sales and on whether Walmart lifts its full-year outlook.
Target Just Raised the Bar
Target's report on Wednesday makes the test harder. Its comparable sales rose 5.6%, with traffic, the number of transactions, up 5.0% and digital comparable sales up 9.8%. It also raised its full-year adjusted EPS outlook to $10.65 to $11.40, from $9.90 to $10.90, and now expects net sales to grow about 6%. Target's quarter covers almost the same August to October period as Walmart's, so investors will compare the two directly.
Notice what did not happen on Wednesday, though. Walmart did not rally with Target. It slipped 0.13%, which suggests the market is reading Target's strength two ways: as proof that shoppers are still spending, and as a sign that Target may have won back some of the customers who had moved to Walmart. Today's numbers need to show that Walmart is still gaining share.
Comparable Sales Are the Number That Matters
Analysts expect Walmart US comparable sales, excluding fuel, to rise about 2.8% to 2.9%, with Bank of America at 2.8% and Zacks at 2.89%. That would be only a small improvement on the second quarter's 2.6%, the slowest pace in the period shown below, and well short of the 4.1% to 4.6% gains of the previous three quarters.
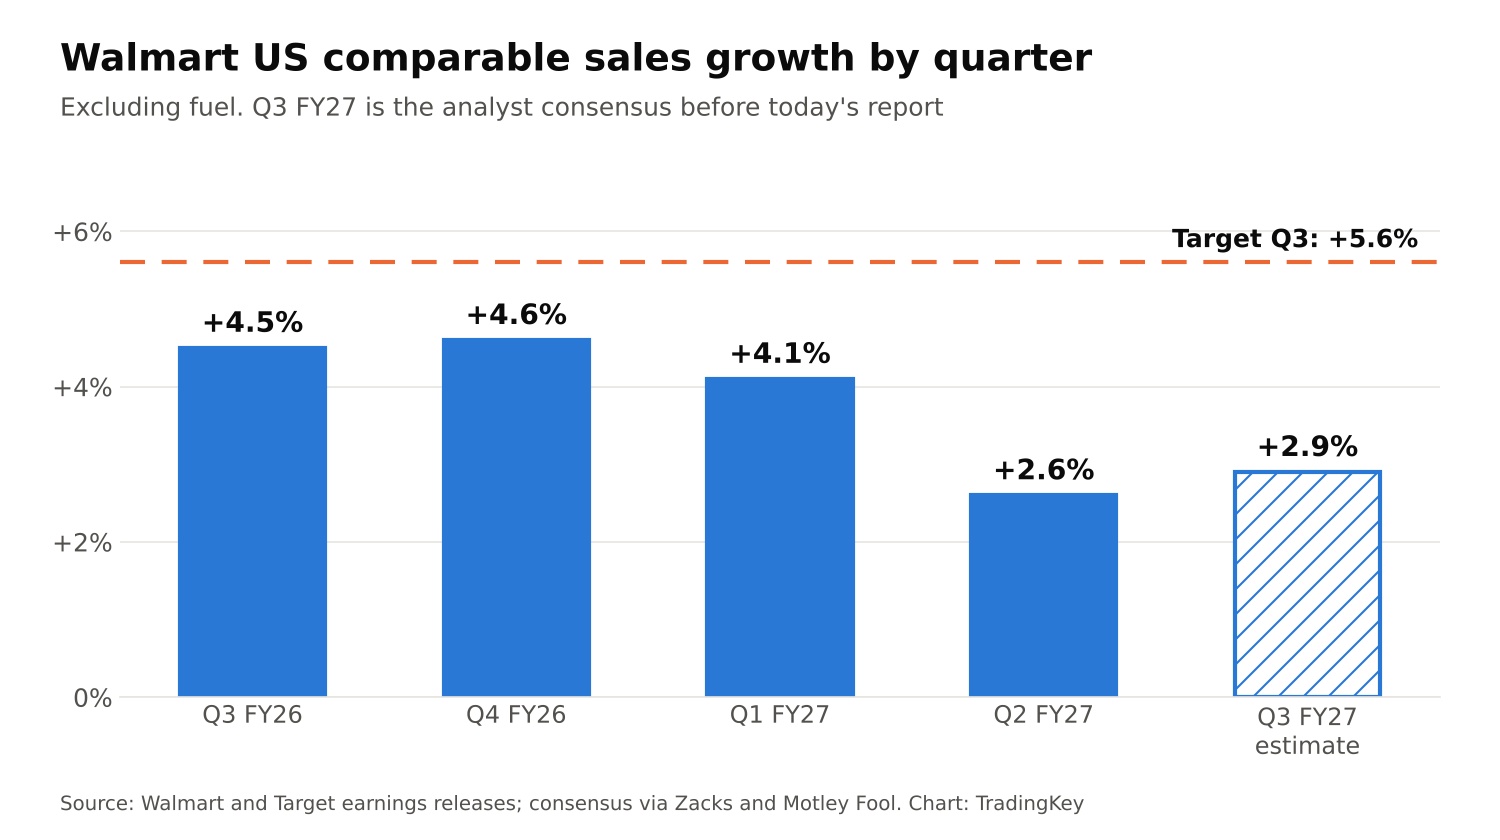
Walmart US Comparable Sales Growth - Source: Walmart, Target, Zacks, Motley Fool
The mix matters too. In the second quarter, e-commerce added 5.1 percentage points to comparable sales, according to the Motley Fool, which means sales in physical stores fell. A comparable figure above 3%, with stores contributing again, would ease the main worry from August.
For the quarter as a whole, Walmart guided adjusted EPS to $0.62 to $0.64, against $0.62 a year ago, and consensus is $0.64, the top of that range. Revenue is expected at about $186.5 billion to $187.3 billion, against $179.5 billion a year earlier. The figure has a built-in headwind, since Flipkart's Big Billion Days sale in India moved from the third quarter into the fourth. The CFO expects "a Q3 headwind of over 100 basis points in sales growth," or more than 1 percentage point.
Guidance Needs to Move Higher
The full-year outlook is the bigger swing factor. Walmart guides adjusted EPS to $2.80 to $2.87, while consensus of about $2.88 to $2.89 already sits above the top of that range, so simply holding guidance could read as a disappointment. Bank of America expects guidance to land toward the upper end.
Margins are the obstacle. Walmart is putting about $2.9 billion of tariff refunds back into lower prices, with rollbacks on more than 11,000 items, and it expects more than $2 billion of extra fuel-related costs this year. Management said the full effect of those price cuts would show in the third quarter, so operating income growth against the 2% to 4% guide is worth watching.
The valuation leaves little room for a miss. At $127.36, Walmart trades at about 44.9 times the midpoint of its full-year EPS guidance, by my calculation, high for a retailer, and its dividend yield is about 0.78%.
Walmart Technical Analysis: Holding $125.10 Keeps the Channel Intact Into Earnings
The 4-hour chart shows how steady the stock has been despite those risks. Since late September, Walmart has climbed inside a rising channel, two parallel lines that have guided prices higher, and it is now sitting right at the lower edge, just above $125.10 support. Buyers defended that zone again on Wednesday, which keeps the uptrend intact. Price also holds above both moving averages, which track the average price over recent sessions, at $123.02 and $118.87.
RSI, a momentum gauge that runs from 0 to 100, sits near 58. The MACD, another momentum indicator, has slipped just below its signal line, so momentum has cooled a little before the report.
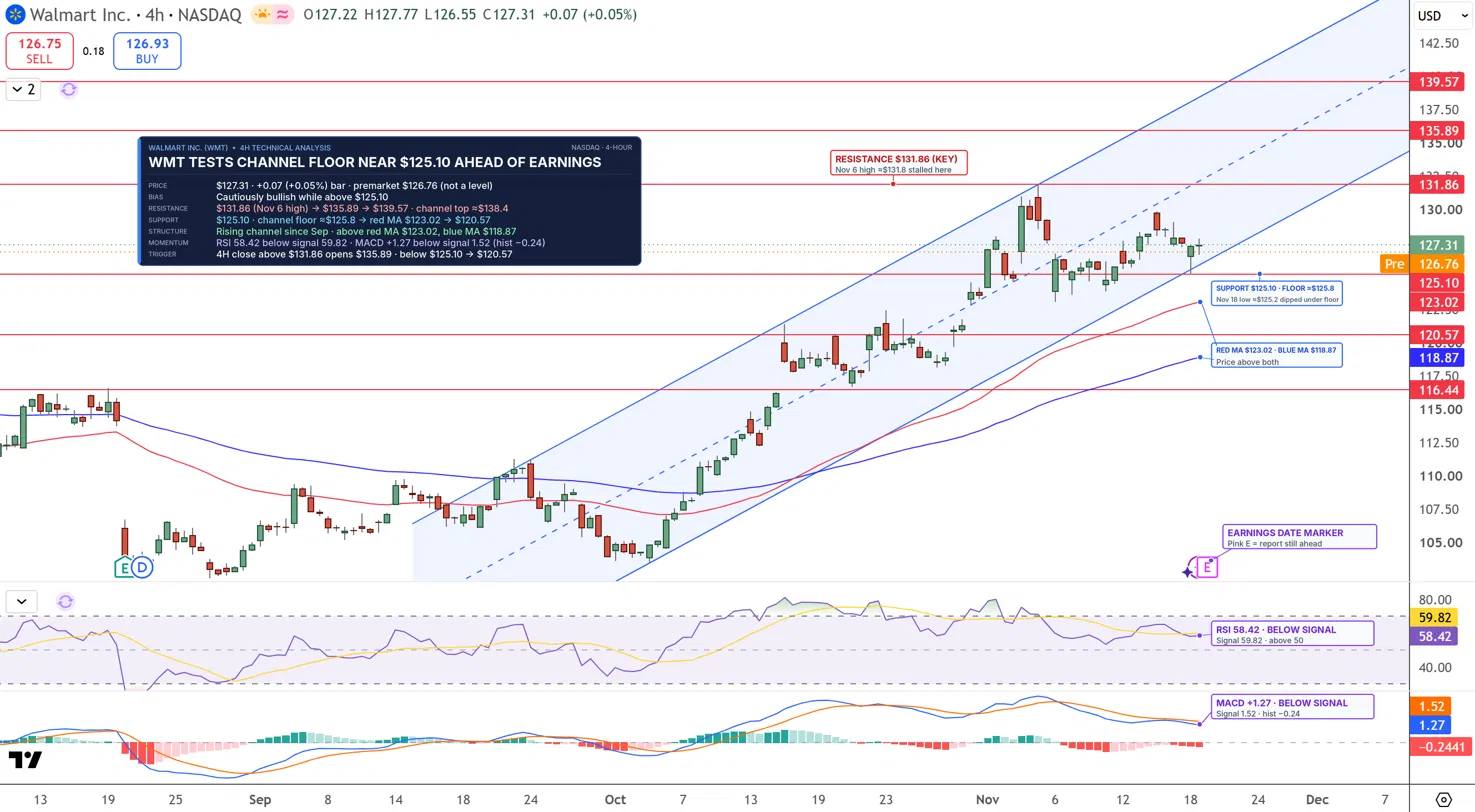
WMT Price Chart - Source: Tradingview
A 4-hour close above $131.86 could open $135.89, just above the 52-week high, followed by $139.57. On the downside, a 4-hour close below $125.10 would break the channel and could send WMT toward $120.57, close to the bottom of the options-implied range.
I'm cautiously bullish while WMT holds above $125.10, with $131.86 as the key breakout level.
Key Levels
- Last close: $127.36, down 0.13% on Wednesday, November 18 (premarket: $126.76)
- Support: $125.10, $123.02, $120.57, $118.87
- Resistance: $131.86, $135.89, $139.57
- RSI: 58.42
- Bullish trigger: 4-hour close above $131.86
- Bearish trigger: 4-hour close below $125.10
FAQs
When does Walmart report Q3 earnings today?
Walmart reports fiscal third-quarter results before the US market opens on Thursday, November 19, with the release due around 7:00 a.m. ET and the call at 8:00 a.m. ET. Consensus is $0.64 a share, with US comparable sales expected to rise about 2.8% to 2.9%.
What is the Walmart stock forecast before earnings?
The bias is cautiously bullish while WMT holds above $125.10, the lower edge of its rising channel. A 4-hour close above $131.86 could open $135.89 and $139.57, while a close below $125.10 could send the stock toward $120.57.
Bottom Line
Walmart goes into its report after three straight post-earnings drops, with Target's strong quarter raising expectations and consensus already above its full-year guidance. The level that matters is $125.10. In my view, comparable sales above 3% and a guidance raise could carry the stock toward $131.86, while a close below $125.10 would point to a fourth straight selloff.
Recommended Articles










Comments (0)
Click the $ button, enter the symbol, and select to link a stock, ETF, or other ticker.