


AMD Stock Forecast: $17 Billion Outlook Brings $511.74 Recovery Test Into Focus



AI Podcast


AMD reported strong Q3 results, driven by a 97% surge in Data Center revenue, and issued a robust $17 billion Q4 revenue outlook. Despite adjusted EPS climbing 74% and strong server shipments, inventory growth and cash conversion warrant caution. The stock rallied in after-hours trading to test immediate resistance between $502.66 and $511.74. A daily close above this zone would invalidate the bearish technical setup and target $544.07, whereas a rejection would preserve downside risks toward $440.49. Fundamental confirmation depends on translating shipments into operating cash flow.

TradingKey - AMD (NASDAQ: AMD) closed November 3 at $483.90, up 3.65%, before reporting earnings. Its stock data then recorded $508.20 at 7:59 p.m. ET, a further 5.02% after-hours gain. That separate price puts the rebound inside resistance.
The $17 billion fourth-quarter revenue outlook strengthens the growth case. However, Helios deliveries must turn rising inventory into sales and cash. The chart now tests whether earnings can repair the earlier trendline breakdown.
Earnings Improve, but the Accounting Gap Needs Context
AMD’s earnings release reports revenue of $13.38 billion, up 45%, with GAAP diluted EPS of $1.46 and adjusted EPS of $2.09, up 74%. The reconciliation includes a $1.097 billion warrant-revaluation loss, reflecting changes in the estimated value of customer rights to acquire shares.
That loss is excluded from adjusted results, alongside other adjustments. Tax effects also materially influence the comparison, so adding the warrant charge directly to EPS would misstate underlying earnings.
Data Center Growth Carries More of the Business
The financial presentation shows Data Center revenue of $8.55 billion, up 97%, and operating income of $2.88 billion, up 168%. Segment operating margin rose to 34% from 25%. These sales include EPYC server processors and Instinct accelerators, not AI graphics processors alone.
Client and Gaming revenue fell 8% to $3.72 billion, while Embedded increased 29% to $1.11 billion. Data Center is therefore doing more of the work. I remain constructive on the operating outlook, provided that faster server and accelerator shipments continue to produce stronger profitability.
The $17 Billion Outlook Raises the Delivery Bar
Management’s quarterly outlook calls for approximately $17 billion in fourth-quarter revenue, plus or minus 3%, or about 66% annual growth. Adjusted gross margin is expected at 55%, compared with 56% in Q3. Gross margin measures the share of sales remaining after direct product costs.
Accelerating sales alongside a lower margin means product mix and delivery costs deserve attention. Larger shipments can lift profit despite a lower margin, but demand alone will not settle the debate.
Helios Must Scale Beyond Early Deployments
AMD’s presentation identifies Anthropic, Meta, Microsoft, OpenAI and Oracle Cloud Infrastructure among users of its first Helios systems. Helios combines processors and accelerators in integrated racks. ROCm 10 software supports the broader offering.
Reuters reports that scarce high-bandwidth memory, which feeds data quickly to AI processors, remains an industry constraint. It also reports Lisa Su’s expectation of more than 80% company revenue growth in 2027. That is a management forecast, with component availability and deployment schedules still decisive.
Cash Conversion Is the Missing Confirmation
On the earnings call, management reported $554 million in free cash flow, the cash remaining after capital expenditure, and roughly $3 billion of sequential inventory growth. Working-capital investment and capacity spending absorbed cash as AMD prepared for higher shipments.
Inventory supports expansion if deliveries follow. Continued accumulation alongside slower collections would be a warning. I would want stronger cash generation before treating the revenue outlook as proof that the expansion is paying for itself.
The balance-sheet presentation lists $15.8 billion in cash and short-term investments against $7.1 billion in debt, including August’s $4.75 billion note offering. Liquidity provides room to execute, but borrowing does not replace operating cash conversion.
December Updates Could Clarify Execution
AMD’s events calendar lists the UBS Global Technology and AI Conference on December 1 and Barclays’ technology conference on December 9. Delivery and margin updates could clarify progress. The next earnings date is not yet listed.
The World Labs agreement also remains pending. AMD announced an $8.2 billion all-stock acquisition, expected to close by year-end subject to approvals and other conditions. It adds AI research expertise, with integration costs and potential dilution from new shares.
AMD Technical Analysis: $502.66 to $511.74 Is Now the Immediate Test
AMD’s $483.90 regular-session close left the daily chart below its broken rising trendline and both moving averages. The subsequent $508.20 after-hours print moved into the $502.66 to $511.74 resistance zone. The original bearish setup therefore needs a fresh rejection, rather than assuming price remains below the entire zone.
The 100-day exponential moving average at $511.74, a trend measure weighted toward recent prices, is the upper test. A daily close above that zone and the broken trendline would invalidate the immediate bearish setup and favor recovery toward the 50-day EMA at $544.07. An extended-hours move alone does not provide that confirmation.
The supplied pre-earnings chart’s RSI, a momentum gauge, was 38.41, weak but not oversold. MACD, another momentum indicator, remained below its signal line and zero; both readings need updating after the earnings move. Rejection from resistance would preserve a slight bearish bias toward $440.49. A daily close below that support would expose $393.62. Holding above the zone would shift the balance toward buyers.
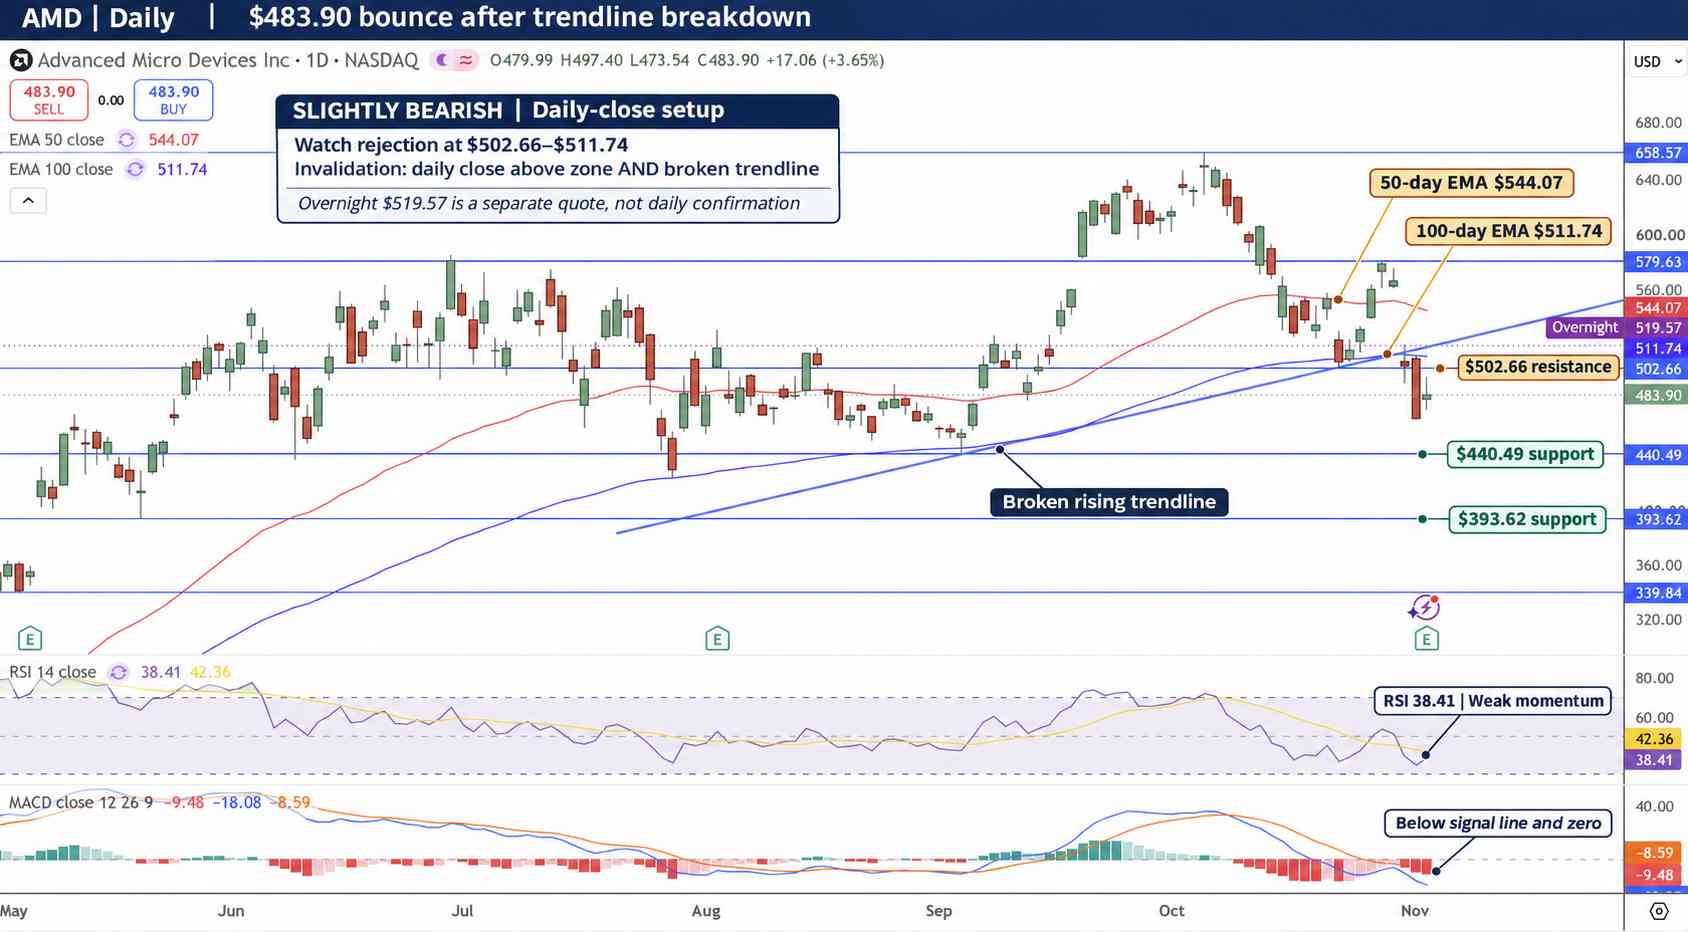
AMD Price Chart - Source: Tradingview
Key Levels
- Latest completed close: $483.90 on November 3, 2026
- After-hours reference: $508.20 at 7:59 p.m. ET on November 3
- Immediate resistance zone: $502.66 to $511.74
- Upside target: $544.07 after reclaiming the zone and broken trendline
- Support and downside levels: $440.49, then $393.62
- Chart RSI: 38.41 before the earnings reaction, weak but not oversold
FAQ
Why did AMD rise after earnings?
The $17 billion quarterly outlook and stronger Data Center performance supported buying. Cash conversion and delivery capacity remain the main operating tests.
What would invalidate AMD’s bearish setup?
A daily close above $511.74 and the broken rising trendline would invalidate the immediate bearish view and put $544.07 in focus.
Bottom Line
AMD’s growth outlook is stronger, but the post-earnings rebound still needs confirmation. Rejection from $502.66 to $511.74 would preserve the slight bearish setup. A daily close above that zone and the broken trendline would favor recovery, while stronger cash conversion would reinforce the fundamental case.
Recommended Articles










Comments (0)
Click the $ button, enter the symbol, and select to link a stock, ETF, or other ticker.