


AMD Stock Price Forecast: Q3 Earnings Beat Expectations, Shares Jump Over 5% After Hours, Could Reach $600



AI Podcast


On November 3 ET, AMD reported third-quarter 2026 revenue of $13.377 billion and adjusted EPS of $2.09, both beating expectations, driven by a 97% surge in Data Center revenue. Fourth-quarter revenue guidance of approximately $17 billion also exceeded estimates. Post-earnings optimism pushed the stock above the $500 mark and its 144-day moving average in after-hours trading, signaling a potential short-term technical recovery. Key resistance is identified at $520.40, while support levels stand at $466 and $425. Despite strong AI-driven growth, risks include high-bandwidth memory supply constraints and projected declines in PC shipments.

TradingKey - On November 3 ET, AMD (AMD) saw its stock move significantly higher in after-hours trading following the release of its third-quarter 2026 financial results. AMD's stock rose 3.65% on the day to close at $483.90, reaching an intraday high of $497.40. Following the earnings release, the stock climbed further in extended trading to around $508, up 5.02%.
Data Center Revenue Grows 97%, Q4 Guidance Tops Estimates
AMD's third-quarter revenue reached $13.377 billion, up 45% year-over-year and exceeding market expectations of approximately $13.09 billion. Adjusted earnings per share were $2.09, above the market consensus of about $1.95. Adjusted gross margin was 56%, while adjusted operating income reached $3.923 billion, up 75% year-over-year.
The primary driver of growth this quarter came from the Data Center segment. Data center revenue reached a record $8.546 billion, up 97% year-over-year and beating market expectations of around $8.2 billion, driven mainly by demand for EPYC server CPUs and Instinct MI450 series AI accelerators. The Data Center segment now accounts for over 60% of AMD's total revenue, further increasing the impact of AI and server products on overall performance.
In contrast, revenue from the Client and Gaming segment was $3.722 billion, down 8% year-over-year. Within this segment, Client revenue was $2.949 billion, up 7% year-over-year, while Gaming revenue fell 40% year-over-year to $773 million. Meanwhile, Embedded segment revenue grew 29% to $1.109 billion.
Fourth-quarter guidance was also above market expectations. AMD expects Q4 revenue to be approximately $17 billion, plus or minus 3%, representing year-over-year growth of about 66% and quarter-over-quarter growth of about 27%, higher than previous market forecasts of roughly $16.23 billion. Adjusted gross margin is expected to be about 55%. The company stated that production of the Helios rack system and the next-generation "Venice" server chips will ramp up in the fourth quarter, with the initial batch of Helios systems currently undergoing testing at Meta.
Management also expects AMD's overall revenue growth rate in 2027 to exceed 80%, above market forecasts of about 77%, and projects that roughly 80% of sales next year will come from data center chips. This guidance further elevates the weight of the Data Center business in AMD's future performance. However, tight supply of high-bandwidth memory (HBM) remains a constraint on AI chip capacity expansion, while the company expects overall PC shipments could see a double-digit decline next year.
AMD Stock Price Technical Analysis
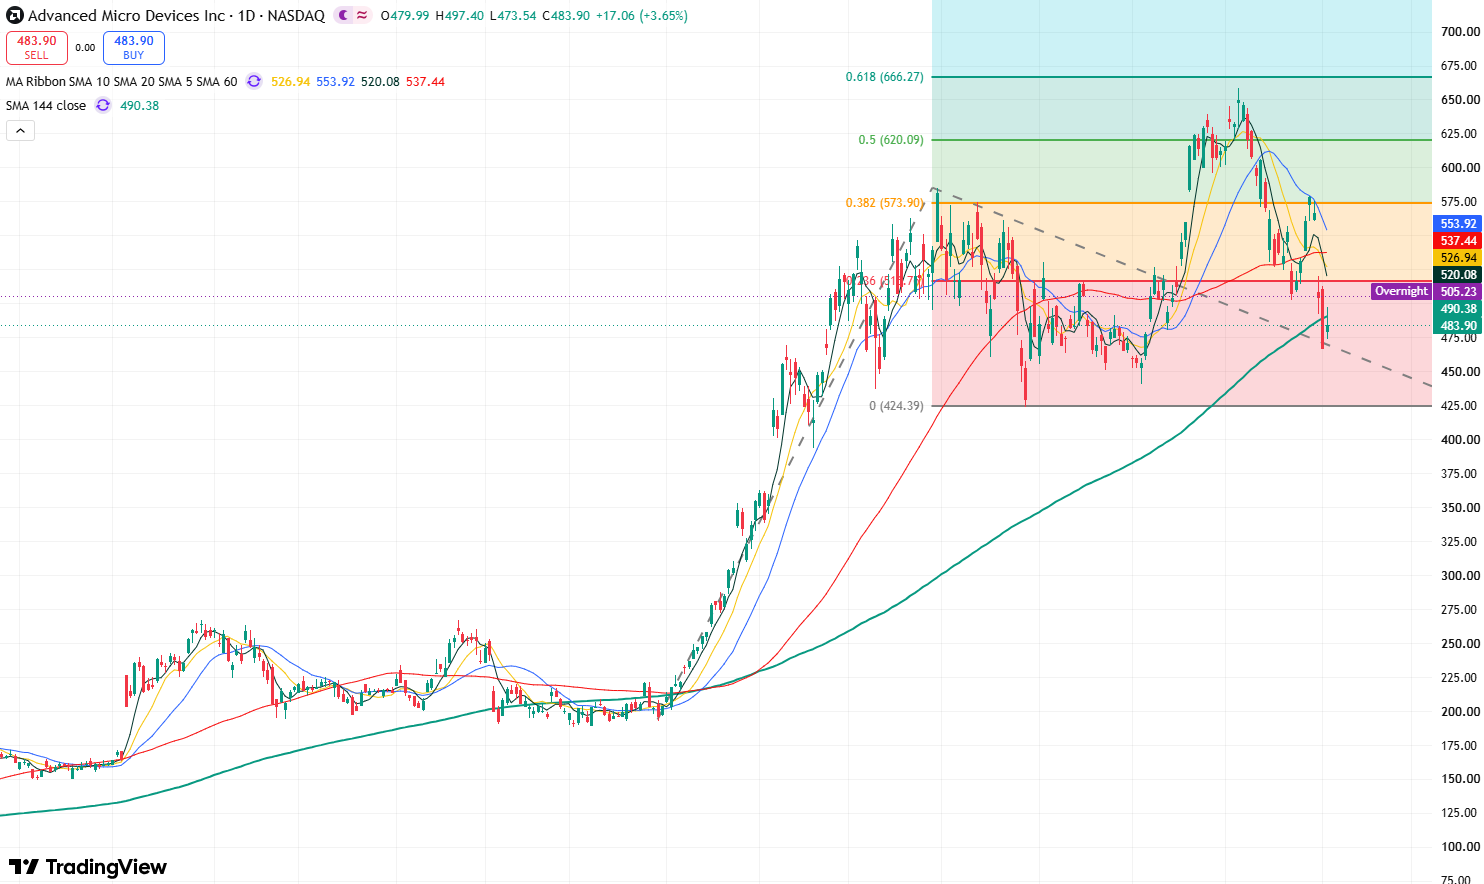
AMD daily stock price chart, Source: TradingView
Looking at AMD's daily stock price chart, the stock recently lost the $500 level and fell below its 144-day moving average, indicating that short-term bears had taken control. However, boosted by positive earnings, the stock reclaimed the $500 mark in post-market trading and moved back above the 144-day moving average, suggesting a recovery in short-term bullish market sentiment.
Currently, if today's opening price continues the post-market momentum from the previous trading session and today's closing price holds firmly above $500 and the 144-day moving average, the stock may initiate a short-term technical recovery rebound. On the upside, the primary resistance level to watch is $520.40. If the stock breaks and holds above this level, it may move higher to fill the previous gap in the $520-$560 range. If it further consolidates above $560, the stock is expected to test the $600 mark.
On the downside, the primary support level to watch is around $466. If this level fails to hold, the stock may further test the key support level at $425. If this level is breached, the stock's medium-to-long-term bullish trend could be intact, shifting it into a more prolonged consolidation phase.
This content was translated using AI and reviewed for clarity. It is for informational purposes only.
Recommended Articles










Comments (0)
Click the $ button, enter the symbol, and select to link a stock, ETF, or other ticker.