


Tesla Stock Price Forecast: Analysts See SpaceX Merger Valuation Exceeding $500 per Share, Technicals Point to $420



AI Podcast


On October 26, Eastern Time, Tesla shares rose over 6% to $396.96, driven by analyst projections that a potential merger with SpaceX could value Tesla above $500 per share by 2027. While independent committees are evaluating the deal, formal terms and shareholder approval remain pending. Technically, the stock has broken above the upper consolidation boundary and the $393.80 Fibonacci level. Short-term EMAs are bullish, though medium-to-long-term trends await confirmation. Sustained support above $393.80 could extend the rally toward $420.01, while failure risks a false breakout, with primary downside support at $380.82 to $383.73.

TradingKey - On October 26, Eastern Time, Tesla (TSLA) shares rose over 6%, reaching an intraday high of $396.96, the highest level since July 13.
Yorkville Ives & Co. analyst Dan Ives said today that if Tesla merges with SpaceX (SPCX), Tesla's transaction valuation could exceed $500 per share. He estimates an 80% to 90% probability that the two sides will reach a deal before the end of 2027.
Ives believes a merger could combine Tesla's autonomous driving and Optimus robot businesses with SpaceX's computing infrastructure, chip design capabilities, and capital. In his $500-per-share valuation, the automotive business contributes about $165, while autonomous driving and Optimus contribute about $335.
This means that the core of the deal pricing lies in how to value businesses that have not yet been fully commercialized. Ives believes Tesla shareholders would resist proposals that undervalue these opportunities; a deal below $500 per share would be equivalent to transferring part of the future growth value to SpaceX at a discount.
However, the valuation hypothesis remains far from a formal agreement. Elon Musk confirmed during the third-quarter earnings call that both companies have established special committees of independent directors to evaluate a potential merger. He recused himself from discussions due to serving roles at both companies, and transaction terms have not yet been agreed upon.
Musk also stated that Tesla needs approval from holders representing 50% of all outstanding shares, rather than just a majority of the voted shares. Therefore, whether the deal can proceed depends on whether shareholders approve the valuation of the automotive business and long-term AI potential in the proposal. Tesla's latest SEC filing also noted there is no guarantee the transaction will ultimately be completed.
From a technical perspective, Tesla's current stock price has crossed above the upper boundary of the recent consolidation zone and sits slightly above the 0.618 Fibonacci retracement level ($393.80). This represents an upward breakout attempt following consolidation, strengthening further compared to the previous range-bound rebounds. Crossing above the high-resistance area that previously capped price gains indicates that the market is attempting to break out of sideways consolidation rather than merely recovering within the range.
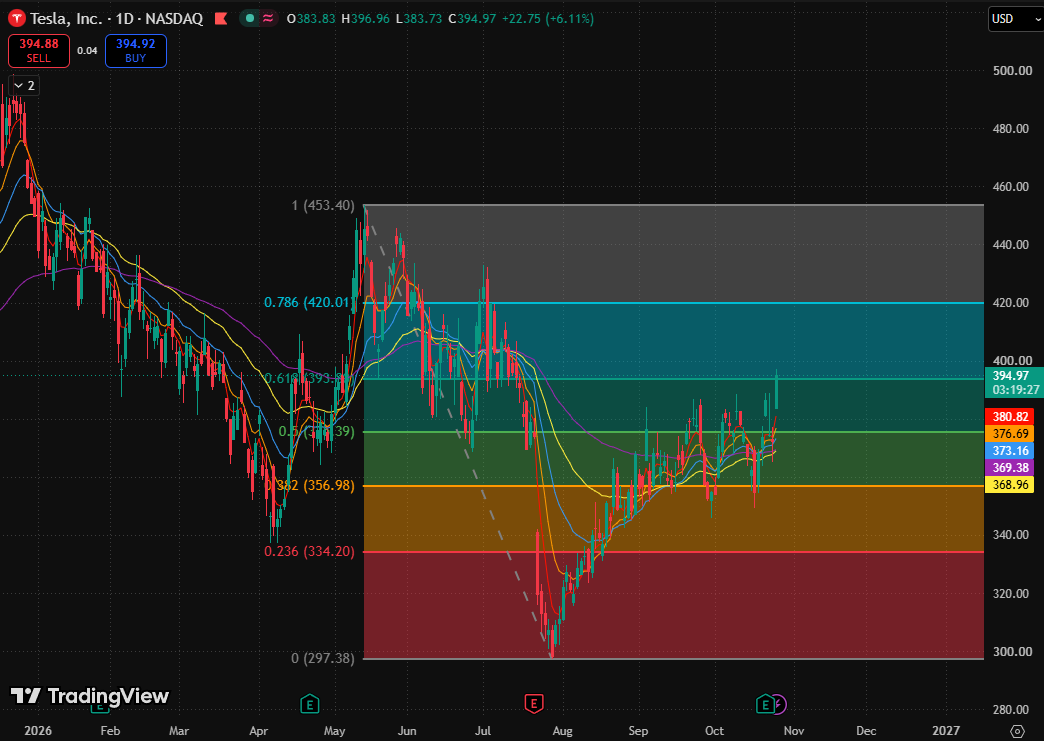
Tesla daily chart, Source: TradingView
Currently, $393.80 has shifted from an upside target to a key pivot for confirming the validity of the breakout. The focus is not on how far it pierces intraday, but on whether previous resistance can be converted into support.
Regarding moving averages, the 5-day, 10-day, and 20-day exponential moving averages (EMA) are in a bullish alignment, with short-term moving averages beginning to spread upward, reflecting strengthening recent momentum. However, the 80-day EMA remains slightly below the 160-day EMA, indicating that medium- to long-term moving averages have not fully aligned. A more accurate assessment is that short-term strength is leading ahead of medium-term trend confirmation.
If the daily chart holds firmly above $393.80 and maintains support during subsequent pullbacks, the breakout is expected to extend toward the 0.786 Fibonacci retracement level ($420.01), placing it adjacent to the historical trading range from June to July.
If the price falls back below this level and fails to recover quickly, it should still be treated as a potential failed breakout at the upper boundary of the consolidation range. The primary downside support lies in the $380.82 to $383.73 range, where the 5-day EMA and the intraday low form the nearest pullback observation zone.
This content was translated using AI and reviewed for clarity. It is for informational purposes only.
Recommended Articles












Comments (0)
Click the $ button, enter the symbol, and select to link a stock, ETF, or other ticker.