


Nokia Stock Price Forecast: Barclays Says Weakness in Traditional Telecom Equipment Market May Drag It Down, $8.37 Is the Bull-Bear Watershed



AI Podcast


Nokia shares dropped to $7.78 following October 22 third-quarter earnings. While AI and Cloud order backlogs support optical communications, Barclays maintains an "Underweight" rating, citing unexceptional 2027 growth outlooks, weak traditional telecom markets, and declining India RAN spending. Barclays projects €2 billion in fourth-quarter AI orders, emphasizing conversion speed into revenue. Technically, the stock exhibits a bearish alignment with moving averages trending downward. Resistance zones cluster between $8.37-$8.57 and $8.96-$9.02. Reclaiming $8.37 is critical to validate any rebound, whereas failing to hold recent lows risks extended downward price action.

TradingKey - Nokia (NOK) fell to as low as $7.78 after reporting third-quarter earnings on October 22, setting a new low since early April this year.
Financial data shows that while Nokia's optical communications business is receiving support as its AI and Cloud order backlog gradually converts into revenue, Barclays believes that the 2027 growth outlook for this segment has not exceeded expectations. Weakness in the traditional telecom equipment market could still drag down overall performance, leading Barclays to maintain an "Underweight" rating.
Nokia's third-quarter AI and Cloud orders fell sharply quarter-on-quarter, but aligned with Barclays' expectations. Rather than single-quarter order volatility, the bank is more focused on how long existing orders can sustain growth and the speed at which they convert into revenue. Barclays expects fourth-quarter AI and Cloud orders to reach €2 billion, with a strong order backlog providing good visibility for business growth in 2027 and beyond.
Nokia stated that it has secured customer orders across multiple products and divisions and is increasing investments to capture further growth opportunities in 2027. This indicates that AI and cloud infrastructure demand has established a foundation for business expansion, with the focus now shifting to delivery capabilities: whether orders convert into revenue on schedule and how much earnings growth the additional investments will generate.
Barclays expects optical communications and IP networks to be the primary growth engines, while growth in fixed networks and mobile infrastructure remains weaker. The bank stays concerned about the slowdown in India's Radio Access Network (RAN) spending, the lack of recovery signs in global telecom capex over the next three years, and the long-term competitive impact of Open RAN. In particular, AT&T's (T) deployment of a large-scale Open RAN network is seen as an example of the structural pressure facing incumbent equipment vendors.
For Nokia, the key to unlocking further valuation upside lies in whether its AI and Cloud business can deliver incremental revenue and profits that exceed current expectations to offset pressures in the traditional telecom market.
From a technical perspective, Nokia is currently in a weak bounce after breaking below its previous low, rather than having found a bottom, let alone a trend reversal. The intraday gain has not altered the fact that the price remains outside its previous consolidation range. Whether the $8.37 level can be reclaimed is crucial to determining the nature of this rebound.
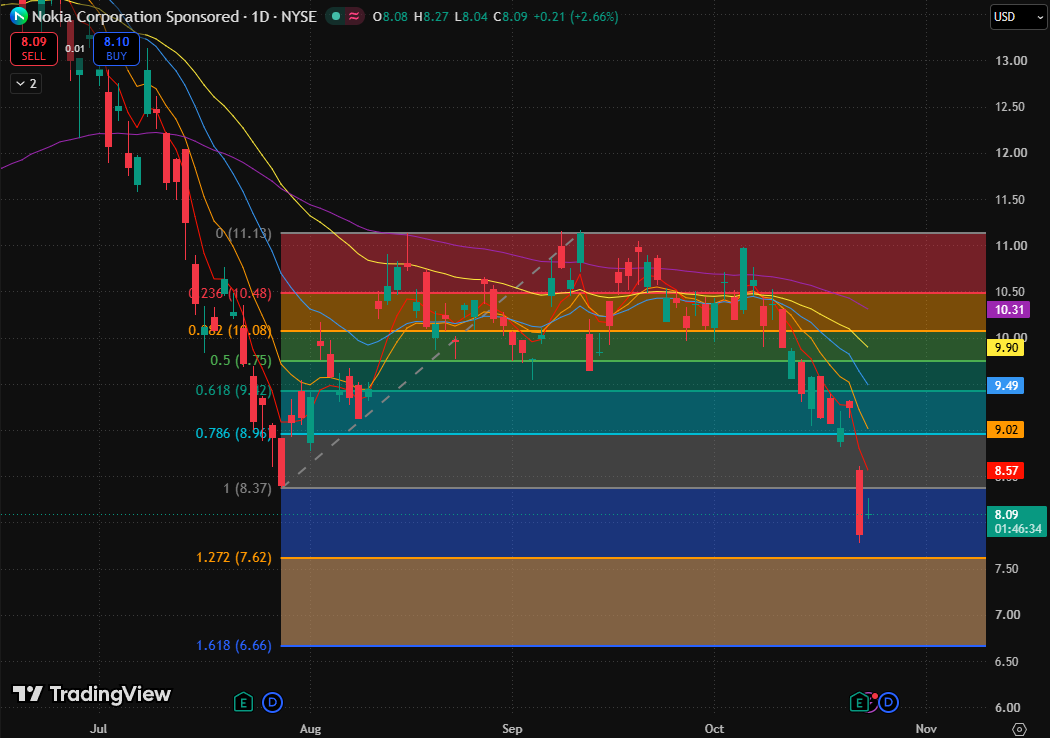
Nokia daily chart, Source: TradingView
The moving averages are ordered sequentially from lower to higher and trending downward as a whole, forming a complete bearish alignment. Short-term moving averages are pressing down rapidly; a price recovery requires not only reclaiming the previous low but also overcoming continuous pressure from the moving averages.
Regarding upside potential for a rebound, the stock first faces a resistance zone between $8.37 and $8.57, corresponding to the breached previous low and the 5-day exponential moving average, respectively. Further up lies a confluence resistance zone between $8.96 and $9.02 from Fibonacci levels and moving averages.
The main risk is that the current rebound fails to form a higher low and subsequently falls below the low of the recent major bearish candlestick, leading prices to extend further downward.
This content was translated using AI and reviewed for clarity. It is for informational purposes only.
Recommended Articles












Comments (0)
Click the $ button, enter the symbol, and select to link a stock, ETF, or other ticker.