


Micron Stock Price Forecast: MU Tumbles Over 6% Nearing $850, Risks Further Drop to $800



AI Podcast


On October 22 Eastern Time, Micron Technology shares dropped 6.26% to $856.49 amid a broader semiconductor sell-off driven by cooling AI risk appetite, lowered tech capital expenditure forecasts, and macroeconomic pressures from rising energy costs and geopolitical tensions. Technically, the stock exhibits a bearish short-term trend, having broken below its 20-day and 60-day moving averages with an RSI of 34.65. While the $850 level serves as critical initial support for a potential technical rebound toward $900, failure to hold this threshold could trigger further downside toward the $820 to $800 support region.

TradingKey - Micron Technology's stock price hit a sell-off in the semiconductor sector, with its short-term trend weakening significantly. On October 22 Eastern Time, Micron Technology (MU) closed down 6.26% at $856.49, hitting an intraday low of $849.25, with trading volume expanding to 32.14 million shares. Although the stock price rebounded to near $884 in pre-market trading on October 23, whether it can hold $850 will still determine the next phase of its trend.
This decline was not caused by a sudden deterioration in Micron's fundamentals, but rather a rapid cooling of risk appetite in the AI and semiconductor sectors. Tesla (TSLA) lowered its full-year 2026 capital expenditure forecast from $25 billion to $20 billion, triggering market concerns over growth in demand for AI, autonomous driving, and robotics chips; although semiconductor equipment maker Lam Research beat expectations, its outlook failed to satisfy investors' high demands, which also exacerbated the industry sell-off. Meanwhile, Meta (META) plans to issue non-voting shares to broaden financing channels for AI investments, reminding the market once again that AI infrastructure expansion remains heavily dependent on external capital.
Rising oil prices and escalating Middle East tensions also amplified market volatility. Higher energy costs could increase inflationary pressures, reviving investor concerns that the Federal Reserve may maintain high interest rates, while rising financing costs directly impact investment returns for data center and AI infrastructure projects. The Philadelphia Semiconductor sector was under broad pressure that day, with chip stocks such as Nvidia (NVDA), AMD (AMD), Intel (INTC), and SanDisk (SNDK) falling in tandem, leaving Micron hit simultaneously by industry deleveraging and profit-taking.
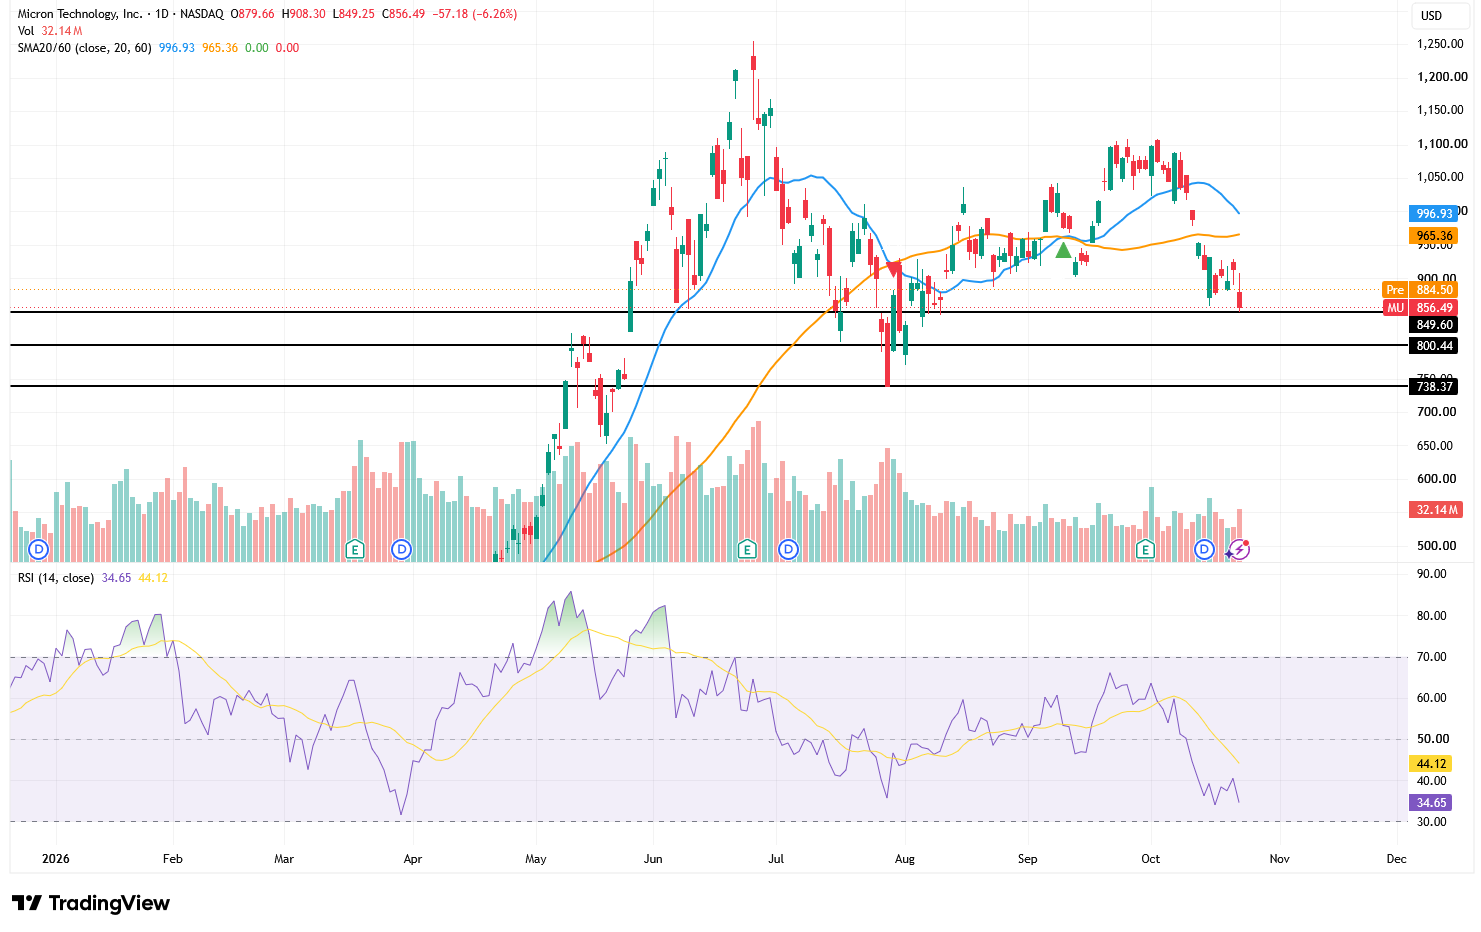
Source: TradingView
From the daily chart, Micron's stock price has broken below its 20-day moving average of $996.93 and 60-day moving average of $965.36, both of which have turned into overhead resistance. The stock has pulled back continuously from near $1,100 recently, dropping to $856.49 on October 22, indicating a clearly bearish short-term trend.
The RSI indicator currently stands at around 34.65, below its smoothed signal line of 44.12, indicating that bearish momentum continues to dominate. As the RSI gradually approaches the oversold zone of 30, the risk of chasing short positions is rising. A technical rebound may occur near $850, but no clear sign of a bottom has formed yet.
In the short term, initial focus should be on support at $850. This level is close to the session low and sits within a previous high-volume trading zone. If Micron can hold $850 and reclaim the post-market rebound high of $882, the stock could further test the $900 mark.
Conversely, if the stock breaks below $850 on heavy volume and closes below this level for consecutive sessions, the next support will fall in the $820 to $800 region. The $800 level serves as both a psychological round-number threshold and lies close to the low-level trading volume zone formed between July and August, which is expected to attract some bottom-fishing capital.
This content was translated using AI and reviewed for clarity. It is for informational purposes only.
Recommended Articles












Comments (0)
Click the $ button, enter the symbol, and select to link a stock, ETF, or other ticker.