


SpaceX Stock Price Forecast: Rebounds to $148 Ahead of Earnings, $152–$160 Becomes Key Resistance Zone



AI Podcast


SpaceX (SPCX) rose 1.32% on Monday (October 19) Eastern Time to close at $147.96, experiencing short-term resistance near $150 following a technical rebound from its October 6 high of $176.42. Strong buying support near the 60-day moving average and $140 level facilitated the recovery ahead of its Q3 2026 earnings release on October 20. Analysts project $12.8 billion in revenue and a potential first net profit. The options market implies a 7.5% post-earnings move. Key support rests at $140–$143, while initial resistance stands at $150–$152. Earnings results and technical breakouts or breakdowns could drive significant near-term volatility.

TradingKey - As of the close on Monday (October 19) Eastern Time, SpaceX (SPCX) closed at $147.96, up 1.32% on the day, reaching an intraday high of $151.01. The closing price was noticeably under pressure below $150, indicating that this level has become short-term resistance. Previously, the stock had been continuously pulling back from its recent high of $176.42 on October 6, falling as low as $140.66 on October 15. The stock rebounded on Monday ahead of earnings, with the movement leaning toward a technical recovery following a high-level pullback.
On the fundamentals front, SpaceX is scheduled to release its Q3 2026 financial results after the U.S. market close on October 20, with the earnings conference call set for 16:30 Eastern Time. The market currently expects quarterly revenue of approximately $12.8 billion and a potential first-ever quarterly net profit. The options market implies a potential single-week stock price move of around 7.5% post-earnings, suggesting that technical breakouts or breakdowns could accelerate significantly around the announcement.
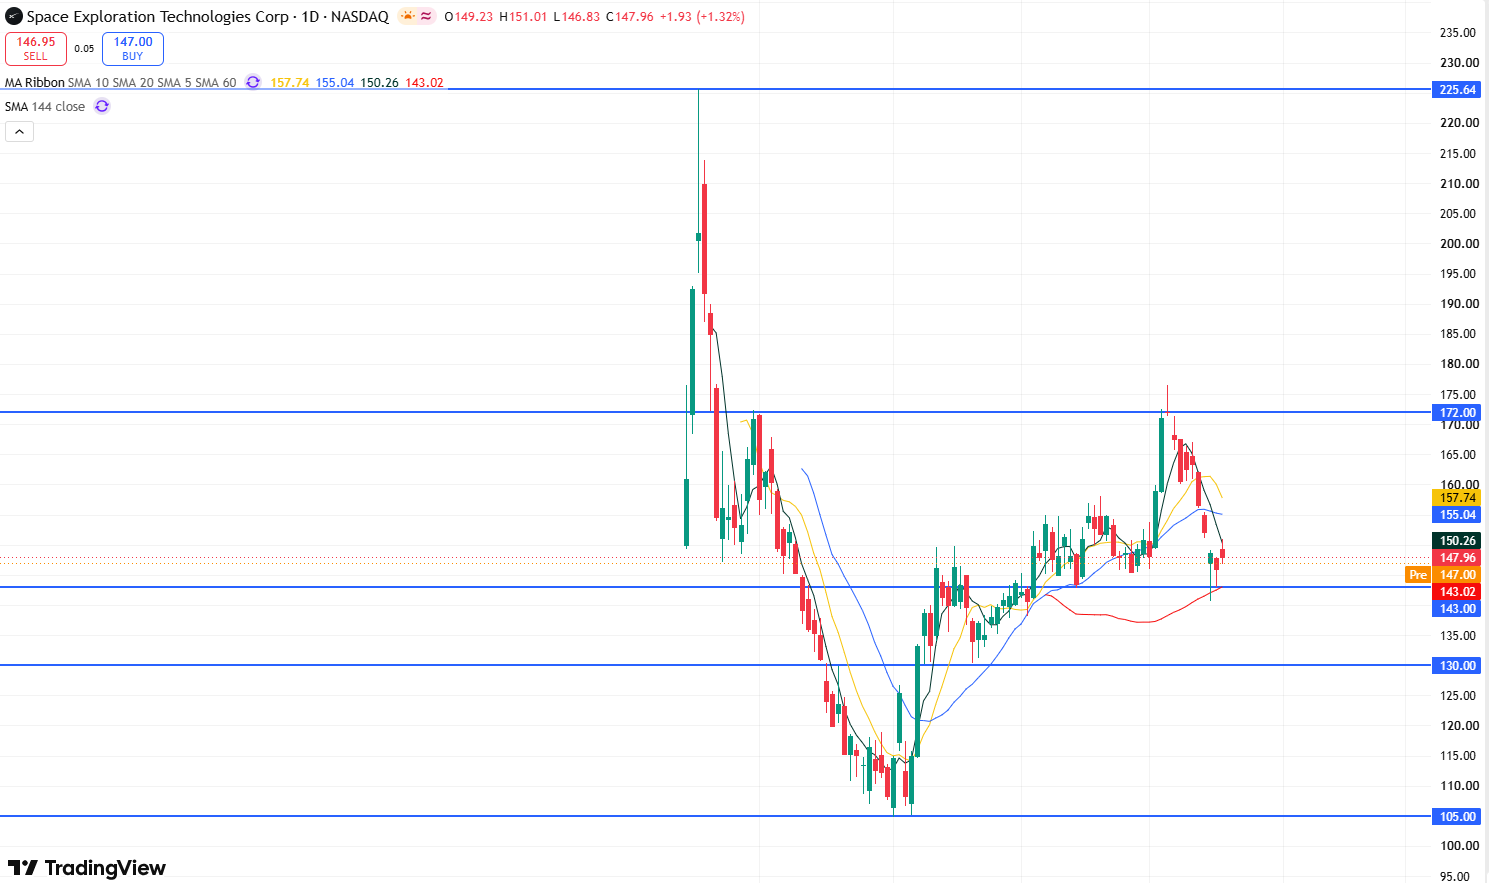
SPCX stock daily chart, Source: TradingView
From a technical perspective, SPCX stock has been in a continuous pullback after reaching a recent high of $176.42 on October 6. It formed long lower shadows above $140 on both Thursday and Friday of last week, indicating strong buying support near this level. Additionally, this level sits above the 60-day moving average, potentially forming a confluent support structure that further bolsters short-term bullish momentum and supports Monday's stock rebound.
Regarding technical indicators, the daily Relative Strength Index (RSI) stands at approximately 45.2, recovering slightly from the previous decline. This indicates that selling pressure has eased compared to before, though definitive bullish momentum confirmation has not yet emerged.
On the downside, initial support to watch is at $145–$147. Further down, more crucial support lies at $140–$143, a zone that has consistently attracted buying interest previously. If $140 is breached, the next key support level to watch is near $130.
On the upside, initial resistance is located at $150–$152, a short-term resistance zone formed following the recent gap-down pullback. If the stock regains a firm footing above $152, the next upside target will test the $155–$160 range; further above, attention should be paid to the $172–$176.42 range.
This content was translated using AI and reviewed for clarity. It is for informational purposes only.
Recommended Articles












Comments (0)
Click the $ button, enter the symbol, and select to link a stock, ETF, or other ticker.