


S&P 500 Index Forecast: Morgan Stanley Says US Stock Pullback Is Nearing an End, Focus on 7,500



AI Podcast


Following last Friday’s 1.09% decline, the S&P 500 faces pressure from tech sell-offs and rising borrowing costs. Morgan Stanley views this correction as a mid-cycle phase nearing its end, maintaining an 8,000 year-end target. Market recovery depends on upcoming tech earnings validating AI capital expenditures and the stabilization of US Treasury yields. Technically, the index broke below key moving averages, with the RSI at 44 indicating neutral-to-weak momentum. Primary downside support rests at 7,610, and a failure to hold this level could trigger a test of the 7,500 low, while resistance stands near 7,740.

TradingKey - At the close last Friday (October 16), the S&P 500 Index fell 1.09% to 7,659.44 points, down 1.95% for the week, primarily impacted by a sell-off in AI-related tech stocks, rising borrowing costs, and the market's reassessment of returns on AI capital expenditures. Entering pre-market trading on October 19, U.S. stocks rebounded, with S&P 500 futures rising by around 0.5% at one point. As the index approached 7,600 points again, Morgan Stanley (MS)'s assessment that the current U.S. stock market correction may be entering its late stage has drawn renewed attention.
Morgan Stanley: Current Pullback Is Nearing an End, but Interest Rates Remain a Key Variable
Morgan Stanley chief US equity strategist Mike Wilson previously noted that US stocks have already undergone months of a "rolling correction." He stated that if bond market volatility fails to decline, the S&P 500 could still experience an index-level pullback of 5% to 10%, though he believes such a drop could mark the final phase of this months-long correction. Wilson maintains that the current environment represents a mid-cycle correction within a bull market, rather than the end of the broader trend.
Although the S&P 500 is still up by about 11.9% this year, market performance under the surface is noticeably weaker than the index itself. Recent data indicates that around 62% of S&P 500 constituents have fallen below their 50-day moving average, with index performance still supported by a small number of large tech and AI-related companies. Third-quarter earnings for S&P 500 companies are currently projected to grow by roughly 30.6% year-over-year, but excluding certain major tech companies, overall earnings growth slows significantly.
Therefore, whether the market can conclude its correction mainly hinges on two key factors: first, whether corporate earnings can demonstrate that AI capital expenditures are translating into revenue and cash flow, with results from major tech firms such as Meta and Tesla this week providing a fresh benchmark; second, whether US Treasury yields can continue to retreat, given that the 10-year Treasury yield recently crossed 5%, increasing discounting pressure on stock valuations. Morgan Stanley recently maintained its year-end target of 8,000 points for the S&P 500, while expressing a preference for large, high-quality companies with stable earnings and high free cash flow.
S&P 500 Index Technical Analysis
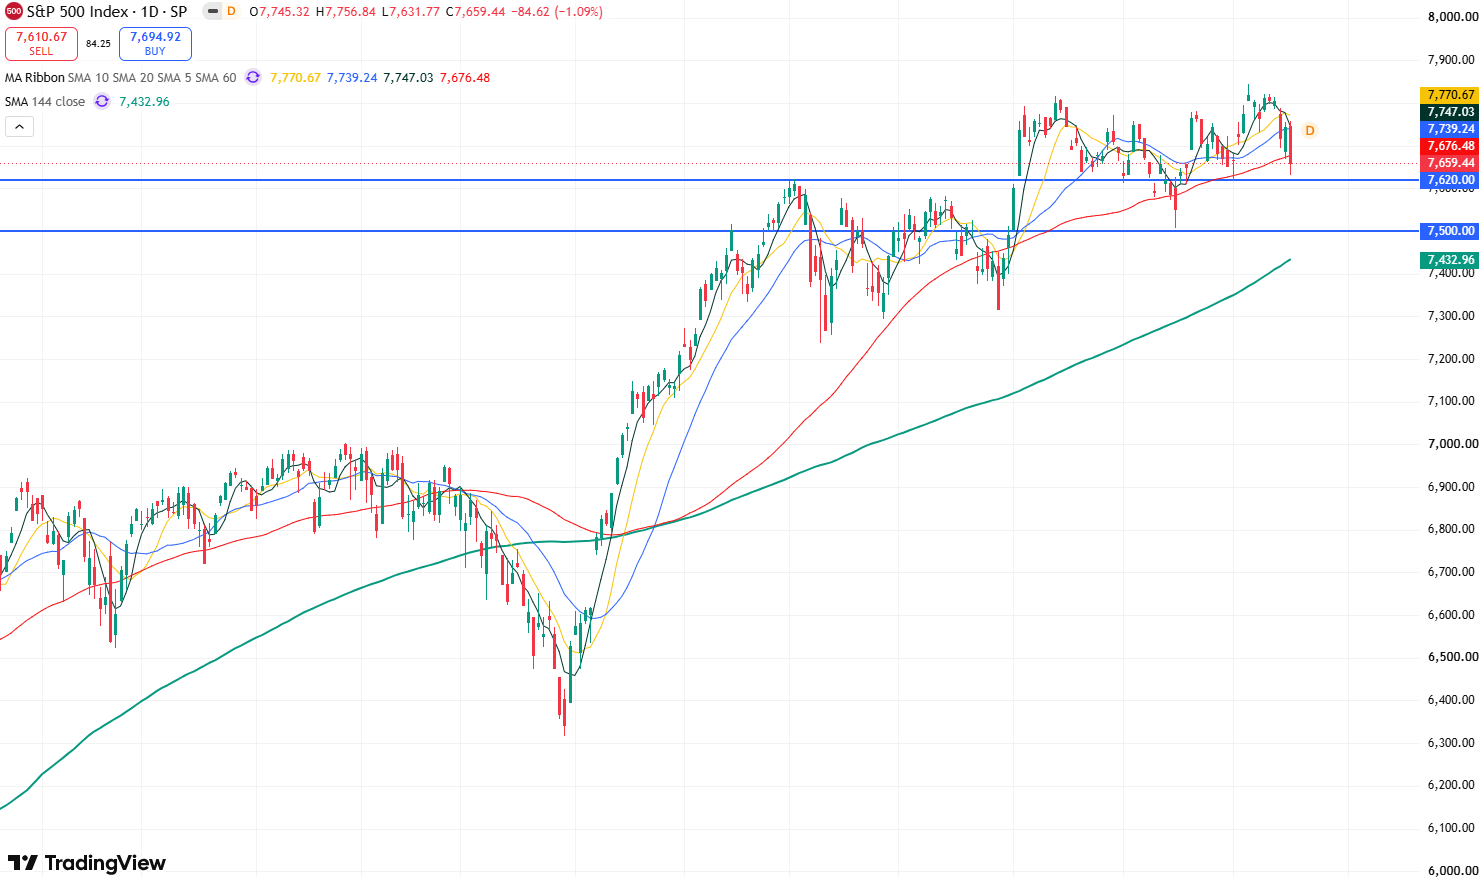
S&P 500 Index daily chart, Source: TradingView
Looking at the daily chart of the S&P 500 Index, following last Friday's sharp drop, the index has successively broken below its 10-day, 20-day, and 60-day moving averages. This tilts the short-term candlestick structure toward a bearish stance, suggesting that further downside remains possible in the near term.
In terms of technical indicators, the Relative Strength Index (RSI) has dropped to around 44, placing it in neutral-to-weak territory. However, it has not yet entered oversold territory, indicating that the index could continue to decline in the short term.
Currently, the primary support level to watch on the downside is 7,610. If this level fails to hold, the index may pull back to test the September 16 low near 7,500. A breach below this mark could open up room for a deeper correction.
On the upside, if the index stabilizes above 7,600 and reclaims 7,700, the next step would be breaking through the 20-day moving average resistance level at 7,740; looking further ahead, attention will turn to the 7,800–7,845 range.
This content was translated using AI and reviewed for clarity. It is for informational purposes only.
Recommended Articles










Comments (0)
Click the $ button, enter the symbol, and select to link a stock, ETF, or other ticker.