


SanDisk Stock Price Forecast: ChangXin Memory’s New DRAM Architecture Collaterally Hits NAND, HBF High-Bandwidth Flash Key to Turnaround



AI Podcast


SanDisk’s recent stock decline stems from market overreaction to CXMT’s DRAM advancements, wrongly conflating DRAM risks with SanDisk’s NAND core business. While technical indicators show short-term bearish momentum and overhead resistance near $1,453.84, SanDisk’s strategic shift toward High Bandwidth Flash (HBF) for AI inference addresses critical memory bottlenecks. Supported by long-term customer agreements securing future bit demand and favorable analyst outlooks projecting a massive HBF addressable market, SanDisk's valuation hinges on successful HBF commercialization rather than sector-wide cyclical fears.
TradingKey - The memory sector recently declined on news that China's CXMT is advancing a next-generation DRAM architecture. However, CXMT is promoting DRAM products such as server DDR5, whereas SanDisk (SNDK)'s main business focuses on NAND flash, enterprise SSDs, and data center storage solutions, with no direct product substitution between the two.
Market concerns over "intensifying competition in memory chips" may be excessively spilling DRAM risks over to SanDisk's NAND business. Currently, SanDisk's stock price is fluctuating near $1,450, hitting a new low since late August.
Why Is SanDisk Stock Falling?
CXMT's 4F² architecture primarily impacts the DRAM market, making its direct competitors closer to Samsung Electronics, SK Hynix, and Micron Technology, rather than SanDisk. DRAM is mainly used in system memory and high-bandwidth memory, while NAND is more commonly used in SSDs, mobile storage, PC storage, and data center capacity storage.
However, in capital markets, DRAM, HBM, NAND, and SSDs are often grouped into the same "memory sector." When investors worry about Chinese companies expanding memory capacity, they often sell off the entire memory supply chain first, rather than evaluating each company's product structure individually. More importantly, the Chinese manufacturers that directly compete with SanDisk's NAND business are NAND producers like YMTC, rather than CXMT, which mainly focuses on DRAM.
Therefore, SanDisk's recent decline looks more like the market mistakenly projecting the "CXMT DRAM risk" onto "NAND and AI storage."
SanDisk’s Real Focus Shifts to High-Bandwidth Flash (HBF)
SanDisk predicted at its Investor Day event that with the surge in artificial intelligence (AI) inference workloads and Key-Value Cache (KV Cache) demand, the Total Addressable Market (TAM) for enterprise data center NAND Flash is expected to reach 1.2 zettabytes (ZB) by 2030.
Meanwhile, SanDisk also disclosed that it has signed new long-term agreements with eight customers, which are expected to cover approximately 50% of its flash bit demand for fiscal year 2027 and about two-thirds of bit demand for fiscal year 2028. The significance of long-term agreements lies in their ability to mitigate the impact of flash memory price volatility on revenue and cash flow, ensuring SanDisk's financial performance no longer relies entirely on spot market prices.
This is also what sets SanDisk apart from traditional cyclical memory stocks. In the past, the market primarily valued SanDisk based on NAND prices, inventory levels, and capacity utilization rates; however, if High Bandwidth Flash (HBF) enters AI inference servers, SanDisk's business logic could shift from "selling more flash memory" to "providing a new memory tier for AI systems."
Goldman Sachs pointed out in a research report released on the 12th that as AI inference demand grows rapidly, insufficient memory capacity is becoming a key bottleneck restricting computing efficiency. Compared to the training phase, AI inference requires long-term retention of model weights, context information, and KV caches, meaning systems may face not just insufficient bandwidth, but also a shortage of usable capacity.
Against this backdrop, High Bandwidth Flash (HBF) is viewed as a potential solution to the "memory wall." HBF seeks to combine the high-capacity and low-cost advantages of NAND flash memory with faster data access speeds, thereby reducing AI inference's reliance on expensive HBM and DRAM capacity. Goldman Sachs estimates that if HBF is adopted in 15% to 50% of AI chips, its addressable market size could reach $40 billion to $150 billion. Consequently, Goldman Sachs favors the technological leadership of SanDisk and SK Hynix in the HBF field, maintaining a "Buy" rating on both companies.
What will truly determine SanDisk's next stock rally is not whether CXMT can expand capacity in the DRAM sector, but whether SanDisk can transform HBF from a technical concept into actual products in AI inference servers.
If HBF begins to gain adoption among major cloud hyperscalers while long-term agreements continue to enhance revenue visibility, SanDisk's stock price could experience a valuation rerating; however, if the commercialization of HBF proceeds slower than expected, the market may still treat it as a highly volatile NAND cyclical stock.
SanDisk Technical Analysis
Looking at SanDisk's stock price chart, the current price has fallen below the 0.5 Fibonacci retracement level (1453.84) and is temporarily holding above the intraday low of $1,403. The current move represents a weak technical rebound following a gap-down decline; the previous pull-back is still continuing, and a bottoming reversal has not yet taken shape.
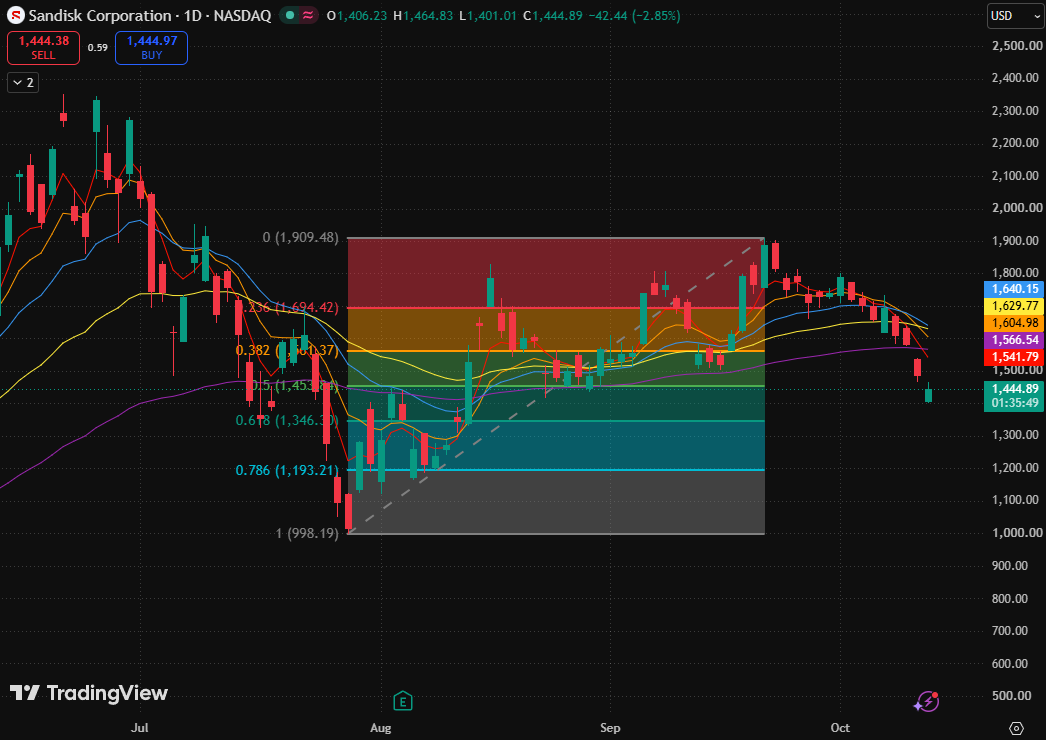
SanDisk daily chart, Source: TradingView
After surging in September, the stock's rebound highs have moved progressively lower. It recently fell below its moving averages and the previous consolidation zone near $1,500 in succession, signaling a clear weakening in the recovery structure since late July.
Regarding moving averages, the 5-day, 10-day, and 20-day moving averages stand at $1,541.79, $1,629.77, and $1,640.15, respectively, forming a short-term bearish alignment; the 80-day and 160-day moving averages are at $1,604.98 and $1,566.54, respectively, still maintaining a longer-term bullish sequence. Therefore, while short-term momentum has weakened and the longer-term structure has been damaged, it cannot yet be classified as a full bearish alignment across all moving averages. With the price trading below all moving averages, any technical rebound continues to face overhead resistance.
As for support below, the $1,400 to $1,406 range is where the intraday low and opening price are concentrated, which, combined with the psychological $1,400 level, marks the initial spot where buying emerged after the gap-down. Currently, there is only evidence of intraday buying support, and the strength of this support remains to be validated by subsequent candlesticks. If the stock falls below this range, it may seek support at the 0.618 Fibonacci retracement level ($1,346.30).
Regarding potential rebound space, only if the stock price reclaims $1,453.84 and holds it on a pullback will conditions be met for a new round of rebound; if it breaks below $1,401.01 and fails to recover, the technical rebound will have failed and the pull-back will continue.
This content was translated using AI and reviewed for clarity. It is for informational purposes only.
Recommended Articles











Comments (0)
Click the $ button, enter the symbol, and select to link a stock, ETF, or other ticker.