


Palantir Stock Price Forecast: Poised to Break All-Time High as Barclays Sees Strong Growth, Stock May Rise to $235



AI Podcast


On October 9 ET, Palantir reached a new intraday high following Barclays’ initiation with a "Buy" rating and a $265 target price. Barclays highlights Palantir's competitive moat, expanding AI adoption, and strong cash flow growth. Technically, the stock exhibits a bullish moving average alignment and trades near its all-time high of $207.52. Sustained closes above this resistance could drive the price toward $235.03, while failure to hold key support levels between $185.87 and $193.63 risks triggering a consolidation phase or deeper retracement.

TradingKey - On October 9 ET, Palantir (PLTR) reached a new recent intraday high. Barclays initiated coverage of the stock with a "Buy" rating and a target price of $265.
Barclays analyst Anthony Valentini stated that Palantir possesses a deep competitive moat, enabling it to achieve unparalleled growth and margin levels. As the adoption of AI applications increases, Palantir is expected to further deepen customer relationships and expand its business scale. Meanwhile, the U.S. government's push for unified data systems also provides growth opportunities for the company's data integration and analytics business.
Valentini believes this customer demand-driven growth reflects the tangible value of Palantir's existing products. Customers continuously expanding their scope of use serves as a key basis for evaluating whether the company can monetize AI application demand. This also forms the core logic behind Barclays' bullish stance on Palantir: growth stems not only from industry attention on AI, but also from the sustained application of its products in customer operations.
On the other hand, despite rapid business expansion, Palantir maintains low levels of M&A spending and capital expenditures. Barclays expects that as free cash flow increases in the coming years, the company will have more room to return capital to shareholders. Compared to simple revenue growth, whether cash flow expands synchronously helps assess how much value growth ultimately creates for shareholders.
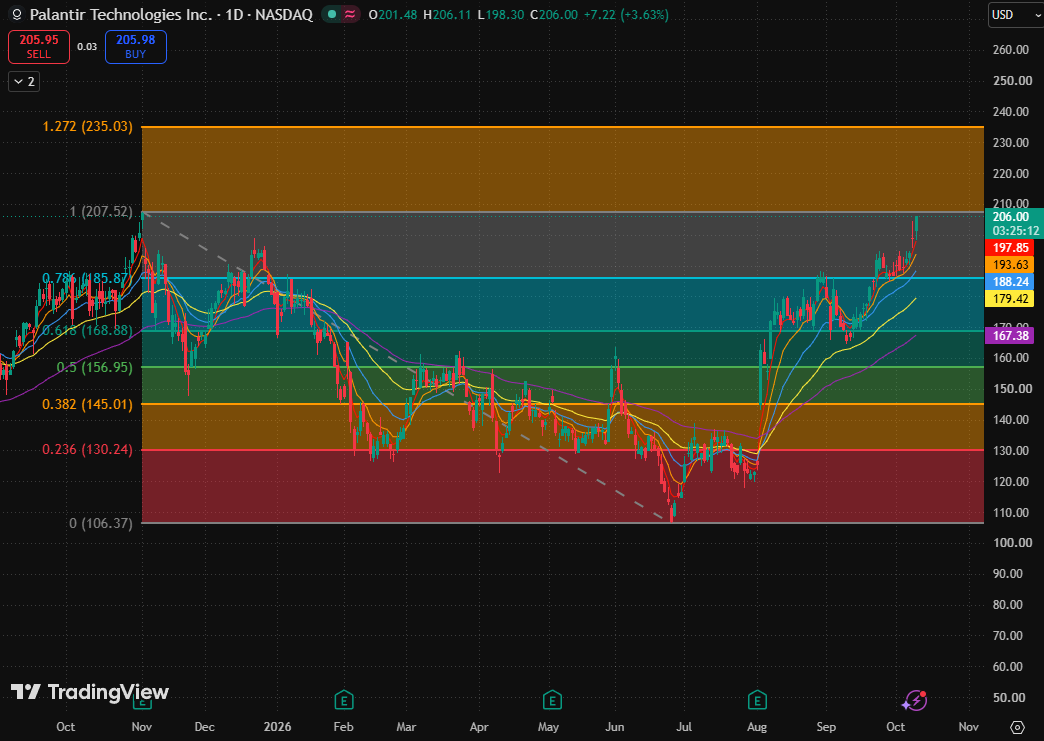
Palantir stock price chart, Source: TradingView
Looking at Palantir's daily chart, the current price of $206 is close to its all-time high ($207.52) and has clearly detached from the 0.786 Fibonacci retracement level ($185.87). The current structure is a breakout test below the previous high.
Regarding moving averages, there is a complete bullish alignment: 5-day MA ($193.63) > 10-day MA ($188.24) > 20-day MA ($179.42) > 80-day MA ($167.38) > 160-day MA ($157.30). The stock price has distanced itself from the 5-day MA, indicating a strong short-term trend.
However, what currently needs to be confirmed is whether $207.52 can turn from resistance to support. Only if the daily close stands firm above $207.52 can the breakout potentially extend to $235.03.
If the stock price retreats below $193.63 after surging higher, it will shift to high-level consolidation. On the downside, it may probe for support in the range between the 0.786 Fibonacci retracement level ($185.87) and the 10-day MA ($188.24). If this area fails to hold, caution is needed against a fallback to the region of the 20-day MA and the 0.618 Fibonacci retracement level.
This content was translated using AI and reviewed for clarity. It is for informational purposes only.
Recommended Articles












Comments (0)
Click the $ button, enter the symbol, and select to link a stock, ETF, or other ticker.