


Apple Stock Price Forecast: iPhone 18 Pro Orders Cut, Can Apple Stock Still Rise?



AI Podcast


Apple shares fell over 2% pre-market on October 9 ET following reports of a 15% to 20% October component order cut for the iPhone 18 Pro and Pro Max due to rising memory chip costs and cautious shipment expectations. While this sparked short-term growth concerns, single-month adjustments may not reflect full-cycle demand. Technically, Apple maintains a medium-to-long-term bullish trend with moving averages in bullish alignment. Key levels to watch include overhead resistance at $345.34 and downside support in the $318–$320 range, alongside upcoming sales volumes and earnings reports.
TradingKey - As of pre-market on October 9 ET, Apple (AAPL) shares fell over 2% pre-market due to rumors that Apple cut iPhone 18 Pro orders. Against the backdrop of the stock previously approaching a periodic high near $345, this news drove a notable pullback in Apple's pre-market stock price.
According to Nikkei Asia, Apple has notified several suppliers of cuts to near-term component production plans for the iPhone 18 Pro and iPhone 18 Pro Max. Since early September, the company has become more cautious regarding shipment expectations, with October component orders reduced by 15% to 20% compared to original plans. Currently, the iPhone 18 Pro and Pro Max start at $1,199 and $1,299, respectively, both up $100 from the previous generation. The report noted that rising costs for memory chips and other components were among the factors behind this price adjustment.
Because the Pro series belongs to Apple's high-end product line, if subsequent actual shipments remain below initial plans, it could affect market expectations for iPhone revenue and product mix. In particular, a declining proportion of Pro models with higher ASPs could prompt the market to reassess hardware revenue growth estimates. Judging by pre-market performance, Apple shares fell around 2% following the report, reflecting a short-term price reaction to the order adjustments.
However, the current order cuts are primarily concentrated in October, and Apple adjusted the launch schedule for the iPhone 18 series this year, with the standard iPhone 18 and the new-generation iPhone Air expected to be delayed until early 2027. Therefore, single-month changes in component orders may not fully represent final demand across the entire iPhone 18 product cycle. Going forward, key factors to watch include actual Pro series sales volume, whether Apple continues to adjust November and December orders, and the iPhone revenue and gross margin figures in the next earnings report.
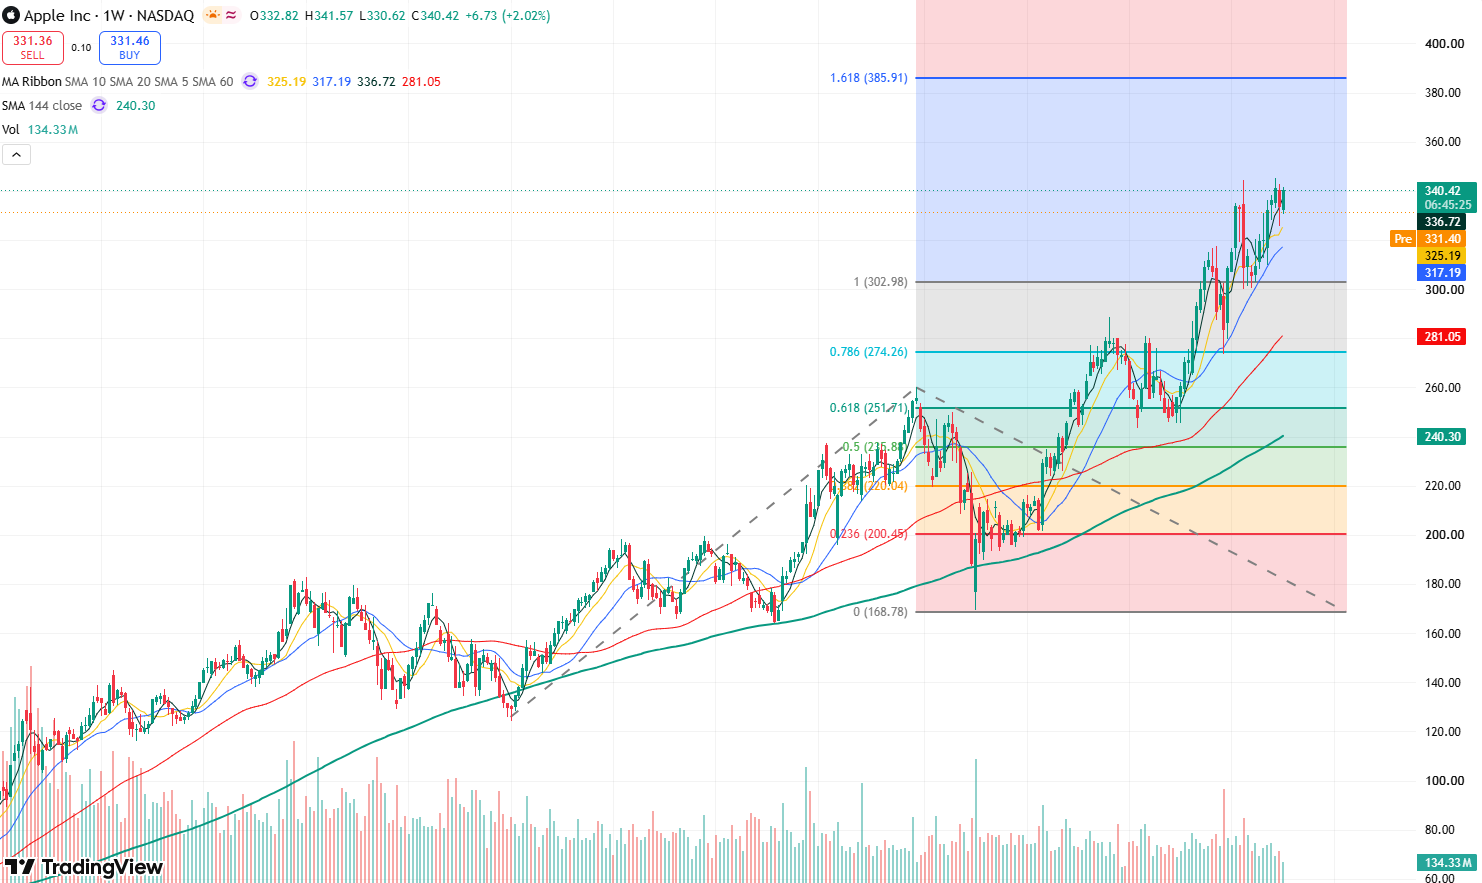
Apple stock daily chart, Source: TradingView
From the daily chart of Apple's stock price, the overall price action shows a clear pattern of higher highs and higher lows, indicating a strong medium-to-long-term bullish trend. Meanwhile, the 20-day, 60-day, and 144-day moving averages maintain a bullish alignment, further confirming the strong sustainability of the medium-to-long-term upward trend.
Currently, the primary overhead resistance to watch is the historical high of $345.34. If the price breaks through and consolidates above this level, it will open up upside space toward $380–$400. On the downside, the primary support level to monitor is the $318–$320 range. If the price falls below $318, it may further test $300, and further down, it could pull back toward around $280.
This content was translated using AI and reviewed for clarity. It is for informational purposes only.
Recommended Articles









Comments (0)
Click the $ button, enter the symbol, and select to link a stock, ETF, or other ticker.