


SpaceX Stock Price Prediction: Reclaiming $150, Can SPCX Break $155 to Spark a New Rally?



AI Podcast


As of Eastern Time September 16, SpaceX (SPCX) shares rose 5.15% to $150.88, driven by Starship developments, Starlink V3 deployments, a $13 billion annualized AI compute contract, and merger speculation with Tesla. The stock has rebounded nearly 12% since late August. Technically, $153–$155 remains a critical resistance zone; a high-volume breakout could target $160–$165, while failure risks a pullback toward initial support at $145 and stronger support near $130.

TradingKey - As of the close on September 16, Eastern Time, SpaceX (SPCX) shares rose 5.15% to close at $150.88, touching an intraday high of $153.01, with trading volume exceeding 100 million shares. Prior to this, the stock price had pulled back for two consecutive trading days, falling to $142.87 at one point on September 15 before quickly recovering, showing strong buying support around $145. Since hitting a period low of $135 on August 24, SPCX has rebounded nearly 12%.
Recent fundamental catalysts primarily stem from Starship and the AI business. SpaceX plans to conduct its 14th Starship flight test on September 22 and deploy next-generation Starlink V3 satellites. Meanwhile, the company recently signed a new AI compute hosting contract with an annualized value of about $13 billion and set a goal to approach a $100 billion annual revenue run rate by the end of the year.
In addition, Musk recently reignited speculation about a potential merger between SpaceX and Tesla (TSLA). When asked on the All-In Podcast why the two companies continue to remain independent, Musk did not explicitly deny the possibility of a merger. The two companies are currently expanding cooperation on projects such as chip manufacturing, though as of now, neither party has announced an official merger plan, timeline, or transaction terms. Therefore, in the short term, this news serves more as a sentiment boost for SPCX stock.
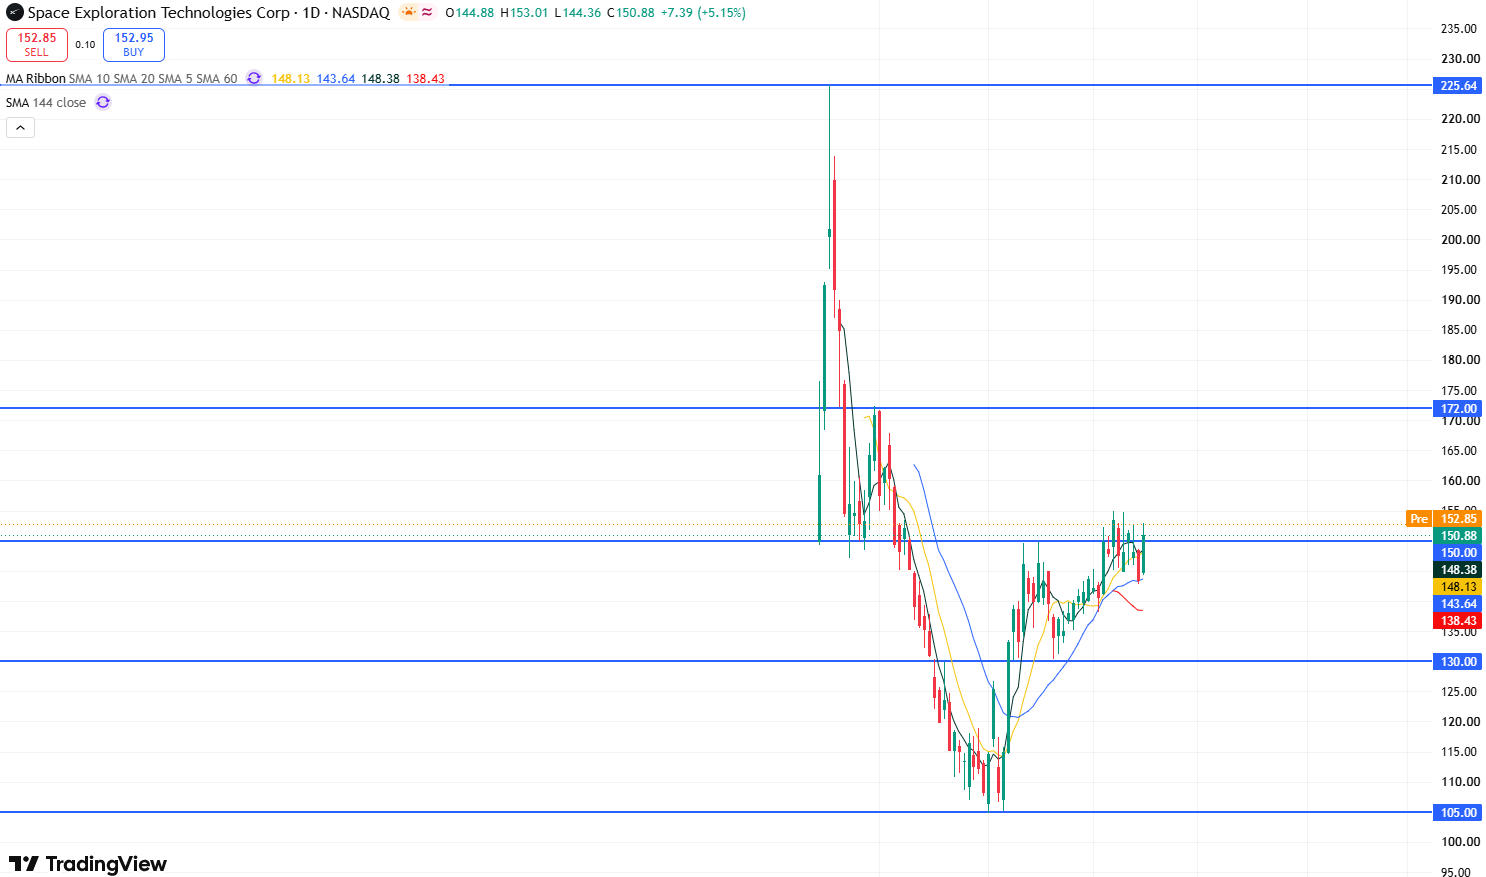
SPCX stock daily chart, Source: TradingView
Looking at the daily chart of SPCX stock, after bottoming near $135 in late August, its lows have consistently moved higher, and it has now returned to the $150 psychological mark. On September 8, the stock touched $155, and on September 10, it reached a high of $154.70, but failed to make an effective breakthrough in either case, indicating that $153–$155 remains the most critical resistance zone at present.
Currently, if SPCX can break through above $155 on heavy volume and hold firm, it would further confirm the rebound structure formed since August. The next targets to watch would be $160–$165, followed by the key resistance level at $172. Conversely, if it encounters resistance near $155 again, the initial support to watch below is $145, an area where buying interest has repeatedly emerged recently. If $145 is lost, it may retest $140, with stronger support remaining near the August low of $130.
This content was translated using AI and reviewed for clarity. It is for informational purposes only.
Recommended Articles









Comments (0)
Click the $ button, enter the symbol, and select to link a stock, ETF, or other ticker.