


S&P 500 Forecast: Barclays Raises Year-End Target to 7,950, Technicals Target 8,000



AI Podcast


Barclays raised its year-end 2026 S&P 500 target to 7,950 and projected 8,800 by 2027, driven by robust corporate earnings and AI infrastructure investments. The bank upgraded its 2026 EPS forecast to $365, mirroring broader Wall Street bullishness. However, Barclays downgraded the utilities sector to "Neutral" amid regulatory uncertainties and cautioned against valuation risks stemming from inflation, geopolitical tensions, and potential Federal Reserve hawkishness. Technically, the index maintains a strong medium-to-long-term bullish alignment, targeting the 8,000 Fibonacci level, with initial support near the 7,600 area.

TradingKey - Barclays recently raised its year-end 2026 target for the S&P 500 Index from 7,800 to 7,950 points, representing an upside of about 4% from the index's September 9 close of 7,636 points. The bank also maintained its positive medium-to-long-term outlook for U.S. equities, projecting the S&P 500 could reach 8,800 points by the end of 2027.
The main rationale behind Barclays' target upgrade is the sustained strength in U.S. corporate earnings. According to LSEG data, among the 492 S&P 500 companies that have reported second-quarter results so far, 86% beat analyst earnings estimates, significantly higher than the long-term average of 67.5%, with mega-cap tech companies showing particularly strong performance.
With corporate earnings outperforming previous expectations, Barclays also significantly raised its 2026 S&P 500 earnings per share (EPS) forecast from $337 to $365. Barclays strategists believe that expanding investments in AI infrastructure and resilient U.S. economic activity will continue to support corporate earnings growth in coming quarters, which is expected to serve as the primary driver pushing the index higher.
However, Barclays remains cautious about further valuation expansion in U.S. stocks. The bank pointed out that risks facing the market include the sustainability of AI capital expenditures, persistently high U.S. inflation, U.S.-Iran geopolitical tensions, and a hawkish shift in Federal Reserve policy. Year to date, the S&P 500 has accumulated a gain of around 12%, leaving market valuations at relatively elevated levels.
By sector, Barclays downgraded the U.S. utilities sector from "Positive" to "Neutral," citing increased approval hurdles for data center construction in certain regions as well as regulatory policy uncertainties.
Recently, Wall Street institutions have also been upgrading their U.S. stock market outlooks. HSBC previously raised its year-end target for the S&P 500 to 8,100 points, while UBS, Goldman Sachs, and Citigroup all currently expect the S&P 500 to reach or exceed 8,000 points by year-end, underscoring that robust corporate earnings and AI investment remain the core drivers behind institutional bullishness on U.S. equities.
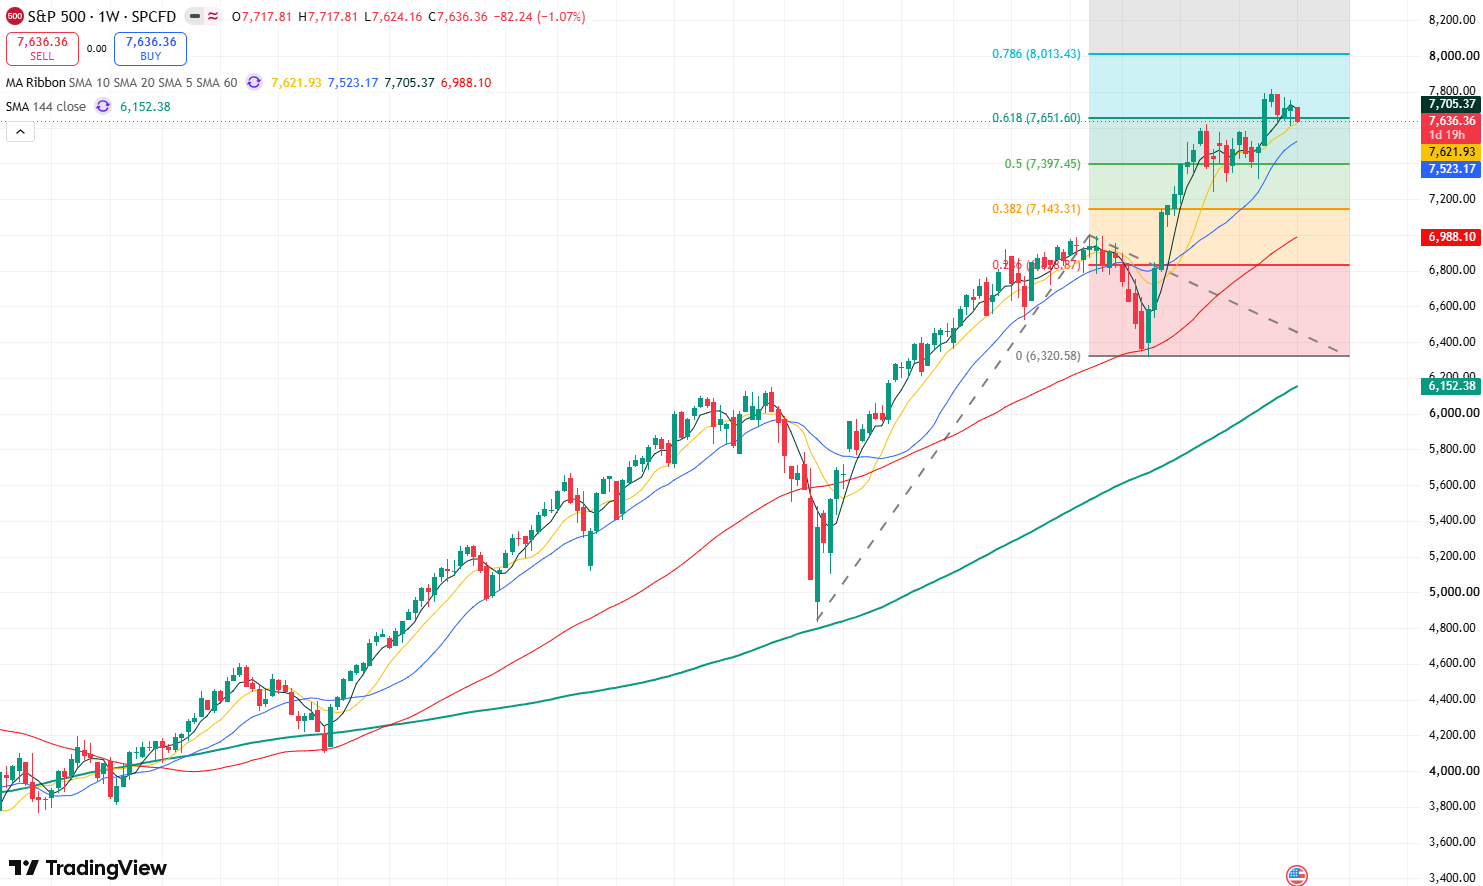
S&P 500 Index Weekly Chart, Source: TradingView
From a technical analysis perspective, on the S&P 500 index weekly chart, the SMA20, SMA60, and SMA144 moving averages exhibit a bullish alignment, indicating that the index's medium-to-long-term uptrend remains intact with strong persistence. Currently, the index has broken above the 0.618 Fibonacci extension level at 7,650, opening up upside potential toward the 0.718 Fibonacci extension level at the 8,000 mark.
On the downside, initial support for the S&P 500 lies at the SMA10 moving average between 7,620 and 7,600. If this level fails to hold, the index could move down to test support at the SMA20 near 7,500.
This content was translated using AI and reviewed for clarity. It is for informational purposes only.
Recommended Articles











Comments (0)
Click the $ button, enter the symbol, and select to link a stock, ETF, or other ticker.