


TrendForce: Micron 2Q26 Conventional DRAM Revenue Grew 65.5% QoQ, CXMT Revenue Rose 99.3%



AI Podcast


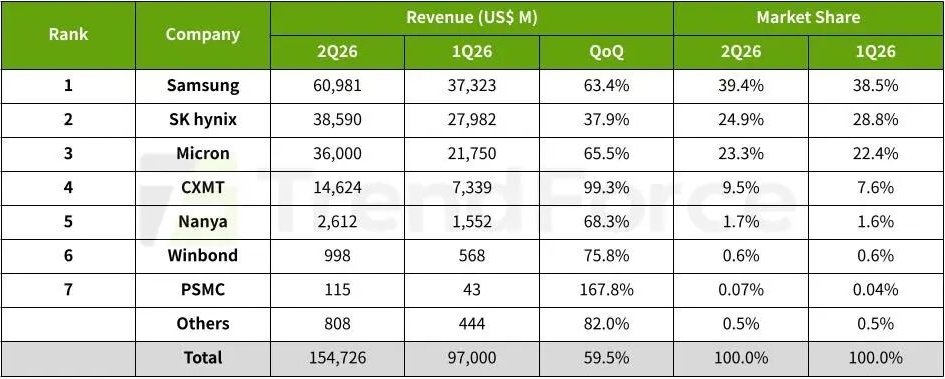
According to TrendForce, surging AI server demand and rising Conventional DRAM contract prices drove second-quarter 2026 global DRAM industry revenue up 59.5% QoQ to $154.73 billion. Samsung led the market with a 39.4% share, followed by SK hynix and Micron, propelled by robust HBM and server product growth. Third-quarter bit shipments are expected to rise slightly, though price increase momentum for Conventional DRAM will moderate. Meanwhile, mature-node suppliers like Nanya, Winbond, and PSMC experienced sharp revenue growth due to strong demand for legacy products left unmet by major suppliers transitioning to advanced nodes.

TradingKey - According to the latest memory industry research from TrendForce, significant increases in Conventional DRAM contract prices in the second quarter of 2026 pushed overall DRAM industry revenue up 59.5% QoQ to nearly $154.73 billion.
As LLM model training and AI inference spur AI server demand, shipments of HBM3e, LPDDR5X, and high-capacity RDIMMs grew simultaneously, while Agentic AI applications drove demand pull-in for RDIMMs across all capacity specifications. On the supply side, with original suppliers' inventories at rock bottom and new supply prioritized for server applications, overall DRAM bit shipments grew modestly in the second quarter.
Looking at key factors impacting third-quarter revenue, quarterly bit shipments will continue to rise slightly. On pricing, as demand for some high-capacity RDIMMs shifts to medium-to-low capacity products, combined with PC and smartphone customers' limited tolerance for price hikes, the QoQ price increase for Conventional DRAM is projected to narrow to 13-18%, with Consumer DRAM seeing the highest gain due to suppliers significantly curtailing supply.
[Source: TrendForce]
TrendForce stated that Samsung led the top three suppliers in Q2 bit shipment QoQ growth as it was the first to introduce HBM4 mass production and shipments. With a significant boost in average selling price (ASP), its quarterly revenue reached $60.98 billion, up 63.4% QoQ, ranking first with a 39.4% market share.
Ranking second in revenue was SK hynix (SKHY), as its HBM accounted for the highest proportion of total bit shipments among the top three suppliers, limiting its ASP gains. Second-quarter revenue grew 37.9% QoQ to $38.59 billion, while its market share slipped slightly to 24.9%.
Micron (MU), under capacity constraints, continued to tilt its product mix toward high-unit-price Server DRAM. Second-quarter revenue surged 65.5% QoQ to $36 billion, with its market share expanding slightly to 23.3%. TrendForce noted that from 2026 to 2027, the top three suppliers will mainly increase bit supply by accelerating upgrades to advanced process nodes, while wafer start capacity expansion will be modestly revised upward through optimizing production processes, acquiring cleanrooms, and reallocating cleanroom space from other product lines.
In contrast, suppliers such as Nanya, Winbond, and PSMC focus primarily on mature-node products, with Q2 momentum sustained by demand left unmet after the top three suppliers transitioned process nodes. Driven by significant increases in DDR4 and DDR3 contract prices, Nanya's total revenue jumped 68.3% QoQ to $2.612 billion. Winbond's revenue grew 75.8% QoQ to $998 million.
PSMC's revenue calculation primarily covers its self-produced Consumer DRAM products, which reached $115 million in the second quarter, representing a sharp QoQ increase of 167.8%. Including foundry revenue, QoQ growth was 54%. Once it secures process technology licensing from Micron, PSMC is expected to aggressively initiate its next wave of supply expansion.
This content was translated using AI and reviewed for clarity. It is for informational purposes only.
Recommended Articles












Comments (0)
Click the $ button, enter the symbol, and select to link a stock, ETF, or other ticker.