


Micron Stock Price Forecast: Tumbles 7% Below $900, Is the Recovery Rally Over?



AI Podcast


On August 24, Eastern Time, Micron shares fell over 7% below $900, reflecting weakened short-term technical structures below key moving averages and the 0.382 Fibonacci retracement level ($935.35). However, industry fundamentals remain robust. Micron researchers and analysts emphasize that High Bandwidth Memory (HBM) is the ultimate AI supply chain bottleneck, driven by structural shortages, high wafer consumption, and cooling challenges. With a 15-to-1 demand-to-supply ratio, surging memory costs will persist. Key downside support rests at the 0.236 Fibonacci level ($859.88), while failure to reclaim $935.35 risks extended consolidation.

TradingKey - On August 24, Eastern Time, shares of Micron (MU) fell back below the $900 mark, plunging as much as 7% intraday, but this does not indicate any change in the memory supply shortage landscape.
Raghu Sreeramaneni, a memory architecture researcher at Micron Technology, pointed out at the Hot Chips 2026 semiconductor conference hosted by Stanford University that memory, particularly HBM, is becoming the ultimate bottleneck in the AI supply chain. Whoever can be the first to break through process and packaging limits will hold the initiative in the next phase of competition.
He noted that the current contradiction lies in a speed mismatch: AI compute performance increases threefold every two years, whereas HBM development has grown less than twofold over the same period, causing the gap to continually widen.
He pointed out that the shortage is structural. The latest HBM packaging integrates two GPUs with eight HBM4 chips, with approximately 90% of the area dedicated to memory. To manufacture an equivalent capacity, HBM consumes roughly three times as many wafers as standard DDR5, and each upgrade requires even more raw material, further expanding the deficit.
Meanwhile, heat dissipation has also become a new bottleneck. HBM features a multi-layer structure where the bottom layer is the hottest while cooling occurs at the very top, requiring thermal relief to penetrate each layer. Consequently, the industry has shifted toward an approach of "calculating heat dissipation first, then adjusting the architecture."
In addition, tech analyst Dan Ives believes that strong demand in the memory market will persist, and the supply shortage landscape is unlikely to change in the short term. As for the AI revolution, the current demand-to-supply ratio in the memory market is around 15 to 1. As memory demand and prices rise in tandem, companies including Apple will have to pay higher memory costs.
Ives stated, "It's the memory providers' world right now, and everyone else is just paying rent." He noted that while cyclical ups and downs will still occur in the memory industry going forward, this multi-year industry cycle will continue to unfold. When asked about the potential for companies to overorder or for inventory shifts to occur, Ives remarked that there is no need to worry about such issues at present, as the situation is beginning to play out according to a bullish scenario.
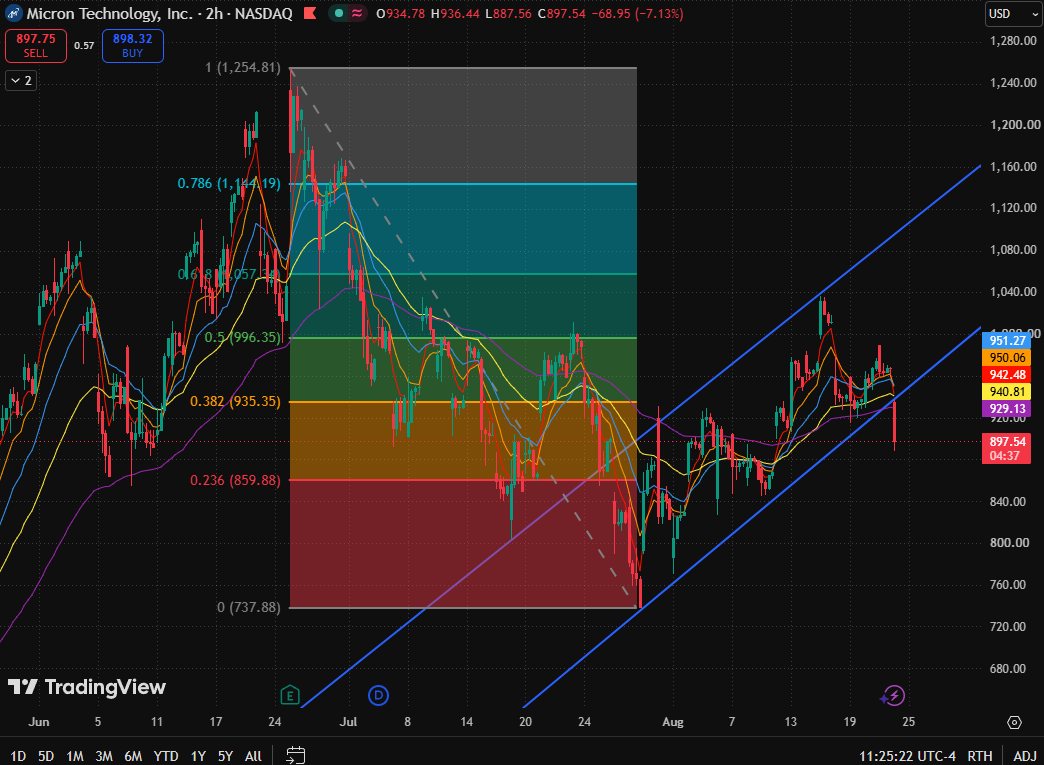
Micron 2-hour candlestick chart, Source: TradingView
After pulling back from near $1,040, Micron's stock price has broken below the 0.382 Fibonacci retracement level ($935.35) as well as the lower boundary of its ascending channel. The short-term structure has weakened significantly, and it is currently testing the 0.236 Fibonacci retracement level ($859.88) to the downside.
Micron's stock price had previously consolidated repeatedly near the 0.382 Fibonacci retracement level ($935.35), but this rapid breakdown below that mark indicates that the former support has temporarily failed.
Regarding moving averages, the current price has simultaneously fallen below the 5-day, 10-day, 20-day, 80-day, and 160-day moving averages, all five of which are now positioned above the stock price. The $929.12–$951.22 range forms a prominent cluster of moving average resistance.
From a trend structure perspective, the stock price has fallen below the lower boundary of the previous ascending channel, meaning that the higher-low structure formed since around $737.88 has been broken. If it fails to reclaim the 0.382 Fibonacci retracement level ($935.35) going forward, this movement is more inclined to be a weak consolidation rather than a routine pullback.
On the downside, key focus should be placed on the 0.236 Fibonacci retracement level ($859.88). If the price can halt its decline and rebound at this level, it may undergo technical repair within the range of $859.88–$935.35; if it breaks down further, the room for adjustment could expand even more.
This content was translated using AI and reviewed for clarity. It is for informational purposes only.
Recommended Articles












Comments (0)
Click the $ button, enter the symbol, and select to link a stock, ETF, or other ticker.