


Apple Stock Forecast: Reclaims $315 After Two-Day Rise, Diverges From SOX Again — Can the Rebound Continue?



AI Podcast


On August 19 US Eastern Time, Apple’s stock demonstrated short-term divergence from the Philadelphia Semiconductor Index, exhibiting defensive strength amid semiconductor weakness. While AI infrastructure drives semiconductor valuations, Apple’s performance relies on its ecosystem and hardware replacement demand. Technically, Apple has reclaimed major moving averages, facing immediate resistance at the $317.52 Fibonacci level and strong support near $300.81. Fundamentally, despite solid financials, forward-looking pressures including supply chain costs, memory prices, and product cycles could generate selling pressure near key resistance thresholds, maintaining a seesaw market dynamic.

TradingKey - On August 19 US Eastern Time, Apple (AAPL) rose for a second consecutive trading session, with its stock price returning to around $315. Meanwhile, the Philadelphia Semiconductor Index continued its weakness, as the short-term performance between Apple and the chip sector diverged once again.
This scene is quite similar to the market performance in July. Apple's stock price rose 6.76% that month and touched an all-time intraday high above $344 on July 29; in contrast, the Philadelphia Semiconductor Index fell 20.61% in a single month, marking its worst monthly performance since 2008, while the Nasdaq 100 Index also declined 6.61% over the same period.
Against the backdrop of the AI boom driving a re-rating of tech sector valuations, Apple not only avoided pulling back with the semiconductor sector but also demonstrated stronger independence and defensiveness. The two phased divergences show that market pricing logic for Apple and semiconductor stocks is diverging: the semiconductor sector is more directly affected by AI capital expenditures, valuation levels, and industry outlook expectations, while Apple's stock performance depends more on its hardware ecosystem, services growth, and whether its AI strategy can translate into replacement demand for end products.
Although two rounds of market performance are not enough to conclude that their long-term correlation has turned negative, at least in the short term, Apple is no longer merely a passive follower of the semiconductor upcycle.
Clayton Allison, portfolio manager at Prime Capital Financial, stated, "It makes sense that Apple does not trade in complete sync with the AI infrastructure supply chain; during certain periods, this inverse correlation can also work against Apple." He added, "When the market worries about corporate spending, Apple's choice not to increase spending looks wise; but now that the momentum of the AI trade is strong, it is hard for Apple to get rewarded from it like other companies."
Jordan McCall, senior portfolio manager at Russell Investments, stated, "Nowadays, the market is more comfortable with capital expenditures, while Apple remains an alternative way to bet on the AI capital cycle. I expect this seesaw market action to continue."
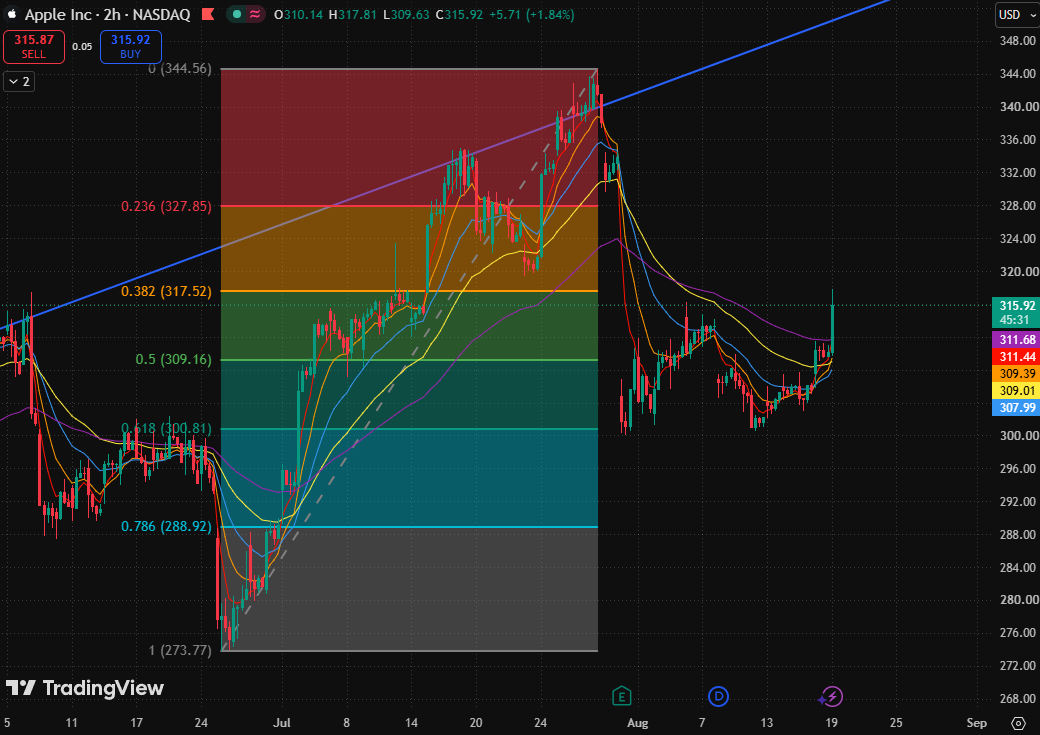
Apple 2-hour candlestick chart, Source: TradingView
Apple's stock price rebounded quickly from near $300 and has now reclaimed its 5-day, 10-day, 20-day, 40-day, and 80-day moving averages, with short-term recovery momentum strengthening noticeably.
The current stock price remains slightly below the 0.382 Fibonacci retracement level ($317.52). This level is also close to the previous rebound high, making it the first confirmation hurdle for judging whether this round of rebound can evolve from an 'oversold recovery' into a 'trend continuation.' If the stock price can continue to trade above major moving averages going forward, the short-term bullish structure is expected to be further consolidated.
The first support level is the 0.5 Fibonacci retracement level ($309.16). This position is close to the dense region of short-term moving averages. If the stock price faces resistance near $317.52 and pulls back, $309.16 will be the first line of defense for assessing whether the rebound structure remains solid.
If $309.16 is lost, support will shift down to the 0.618 Fibonacci retracement level ($300.81). The area around $300 serves as both a previous low zone and the starting point of this rebound, holding strong technical significance as a bull-bear boundary line. As long as the stock price can hold $300.81, the rebound structure following the sharp decline can still be considered intact.
If the stock price can firmly hold above $317.52 on high volume going forward, the rebound target could look further toward the 0.236 Fibonacci retracement level ($327.85). This level is both the next major Fibonacci resistance and close to a dense trading region from the previous decline, making a breakthrough potentially more difficult than at the current stage.
However, Apple's recent fundamentals present a contradiction of "strong financial results but rising forward-looking pressures." While previous earnings were solid, the market remains focused on supply chain costs, memory chip prices, services growth rates, and upcoming product cycles. If these factors continue to weigh on earnings expectations, the stock price may face substantial selling pressure near key resistance levels.
This content was translated using AI and reviewed for clarity. It is for informational purposes only.
Recommended Articles







Comments (0)
Click the $ button, enter the symbol, and select to link a stock, ETF, or other ticker.