


Applied Materials Recovered to $548 and Is Testing $554.94 Breakout — Earnings Tonight Will Confirm



AI Podcast


Applied Materials has surged 26% from its July low, testing a critical breakout resistance of $554.94 ahead of its Q3 fiscal 2026 earnings report. Driven by AI data centers, advanced packaging, and transistor innovations, the company anticipates over 30% semiconductor equipment growth. While technical indicators show strong momentum with an RSI of 61, valuation remains stretched at a 43.8x forward P/E, leaving little margin for error. Investors must monitor whether Q3 earnings confirm sustained multi-year AI demand and a recovery in free cash flow to justify this valuation premium.
TradingKey - Applied Materials (AMAT) has executed an excellent recovery, taking the stock up from a $436 low to $548.34. It is now testing the level of importance at $554.94, just ahead of the company's third-quarter fiscal 2026 earnings report scheduled for tonight (August 13 after market close). It has a solid momentum for price against a significant resistance area, with RSI at about 61, above the signal line and comfortably in the buy range. Price also recovered above the major moving averages at $532.09 and $538.35. It has created a solid base for a break-out.
Fundamentally, everything remains strong, as the company expects 30% plus growth in semiconductor equipment in 2026. The AI data-center, advanced packaging and transistor innovations are all expected to accelerate. There is a 43.8x multiple on forward P/E, meaning there isn't much room for misunderstandings.
Traders believe $554.94 is the key breakout level, and if it is, that price would then be exposed to $582.85, $613.67, and $651.12. For investors, the key thing to watch for is if 30% plus growth in AI equipment for fiscal 2027 is sustained, otherwise the valuation premium is not justified.
The Recovery: From $436 Low to $548 in Six Weeks
Applied Materials bottomed near $436 in July, valuation concerns prevailing over optimism for AI equipment. And then the company's record $7.91B revenues and strong forward guidance, catalyzed a monster 26% move, taking Applied Materials stock from $436 up to $548.34. This recovery was solid and decisive. It created strong conviction that the AI equipment cycle was solid, and institutional buyers were investing once again.
I consider the recovery structure to be constructive. Consequently, I'm bullish on $TSLA. Patterns which indicate recovery include a structure of higher lows, price action which is well above both moving averages, and an RSI value which is in the 55-65 range, but which is not overbought. Further, we have a range consolidation between $511 and $550 and, thus, a base which is currently being tested from above. If $554.94 breaks (on earnings confirmation) and the base is held, then logical technical targets of $582+, $613+, and $650+ are within reason.
The Fundamentals: 30%+ Equipment Growth, Three Demand Drivers
Applied Materials is in a rare scenario that combines all three main demand drivers. First, the hyperscalers are intensively building AI data center capacity. Second, chipmakers are constructing logic and DRAM factories for AI training and inference. Third, companies are moving to more complex transistors (e.g. Gate-All-Around).
Management anticipates that during the year 2026, almost 80% of total WFE growth will come from leading edge foundry logic, DRAM, and advanced packaging. Of those three, advanced packaging is projected to grow over 50% in 2026, with a large shift to the chiplet based architecture by the chipmakers.
Q2 Performance: Record Revenue and Margins
Applied Materials posted record results for Q2 with revenue coming in at $7.91 billion (an 11% increase over the previous year) and GAAP EPS of $3.51 and non-GAAP EPS of $2.86. The Semiconductor Systems segment posted revenue of $5.97 billion at an op margin of 35.1%. Applied Global Services achieved revenue of $1.67 billion with a 29.2% op margin. The dividend was increased to $0.53 per share (for the ninth straight year of dividend growth).
Q3 Expectations and the Critical Metrics
Consensus revenue for Q3 is $9.04 billion with non-GAAP EPS of $3.36, a 23% increase YoY. This would be another record setting result (better than Q2 results) and an indication that the AI equipment cycle is continuing. However, with free cash flow falling by 80% in Q2 to $210M, there’s a large concern about whether there was a large margin compression or if there was large timing of capital outflows. Investors will be watching to see if free cash flow recovers in Q3.
Valuation Remains Stretched at 43.8x Forward P/E
At a forward P/E of 43.8x, AMAT is trading at a significant premium to its historical average of 21.18x. EVEN AT 30%+ Equipment growth, that multiple requires confidence in long-term demand visibility. The consensus price target of $603.23 (12% upside) balances the AI bull case and valuation concerns when the 'data center buildout' is complete.
Technical Setup: Constructive Recovery, $554.94 Breakout Imminent
AMAT has shown signs of a strong recovery on the 2 hour chart from $436 to the current $548.34. Price is now testing the key resistance level of $554.94. The range bound stock has also formed a constructive base within the $511 to $550 range and is now trading in the upper range.
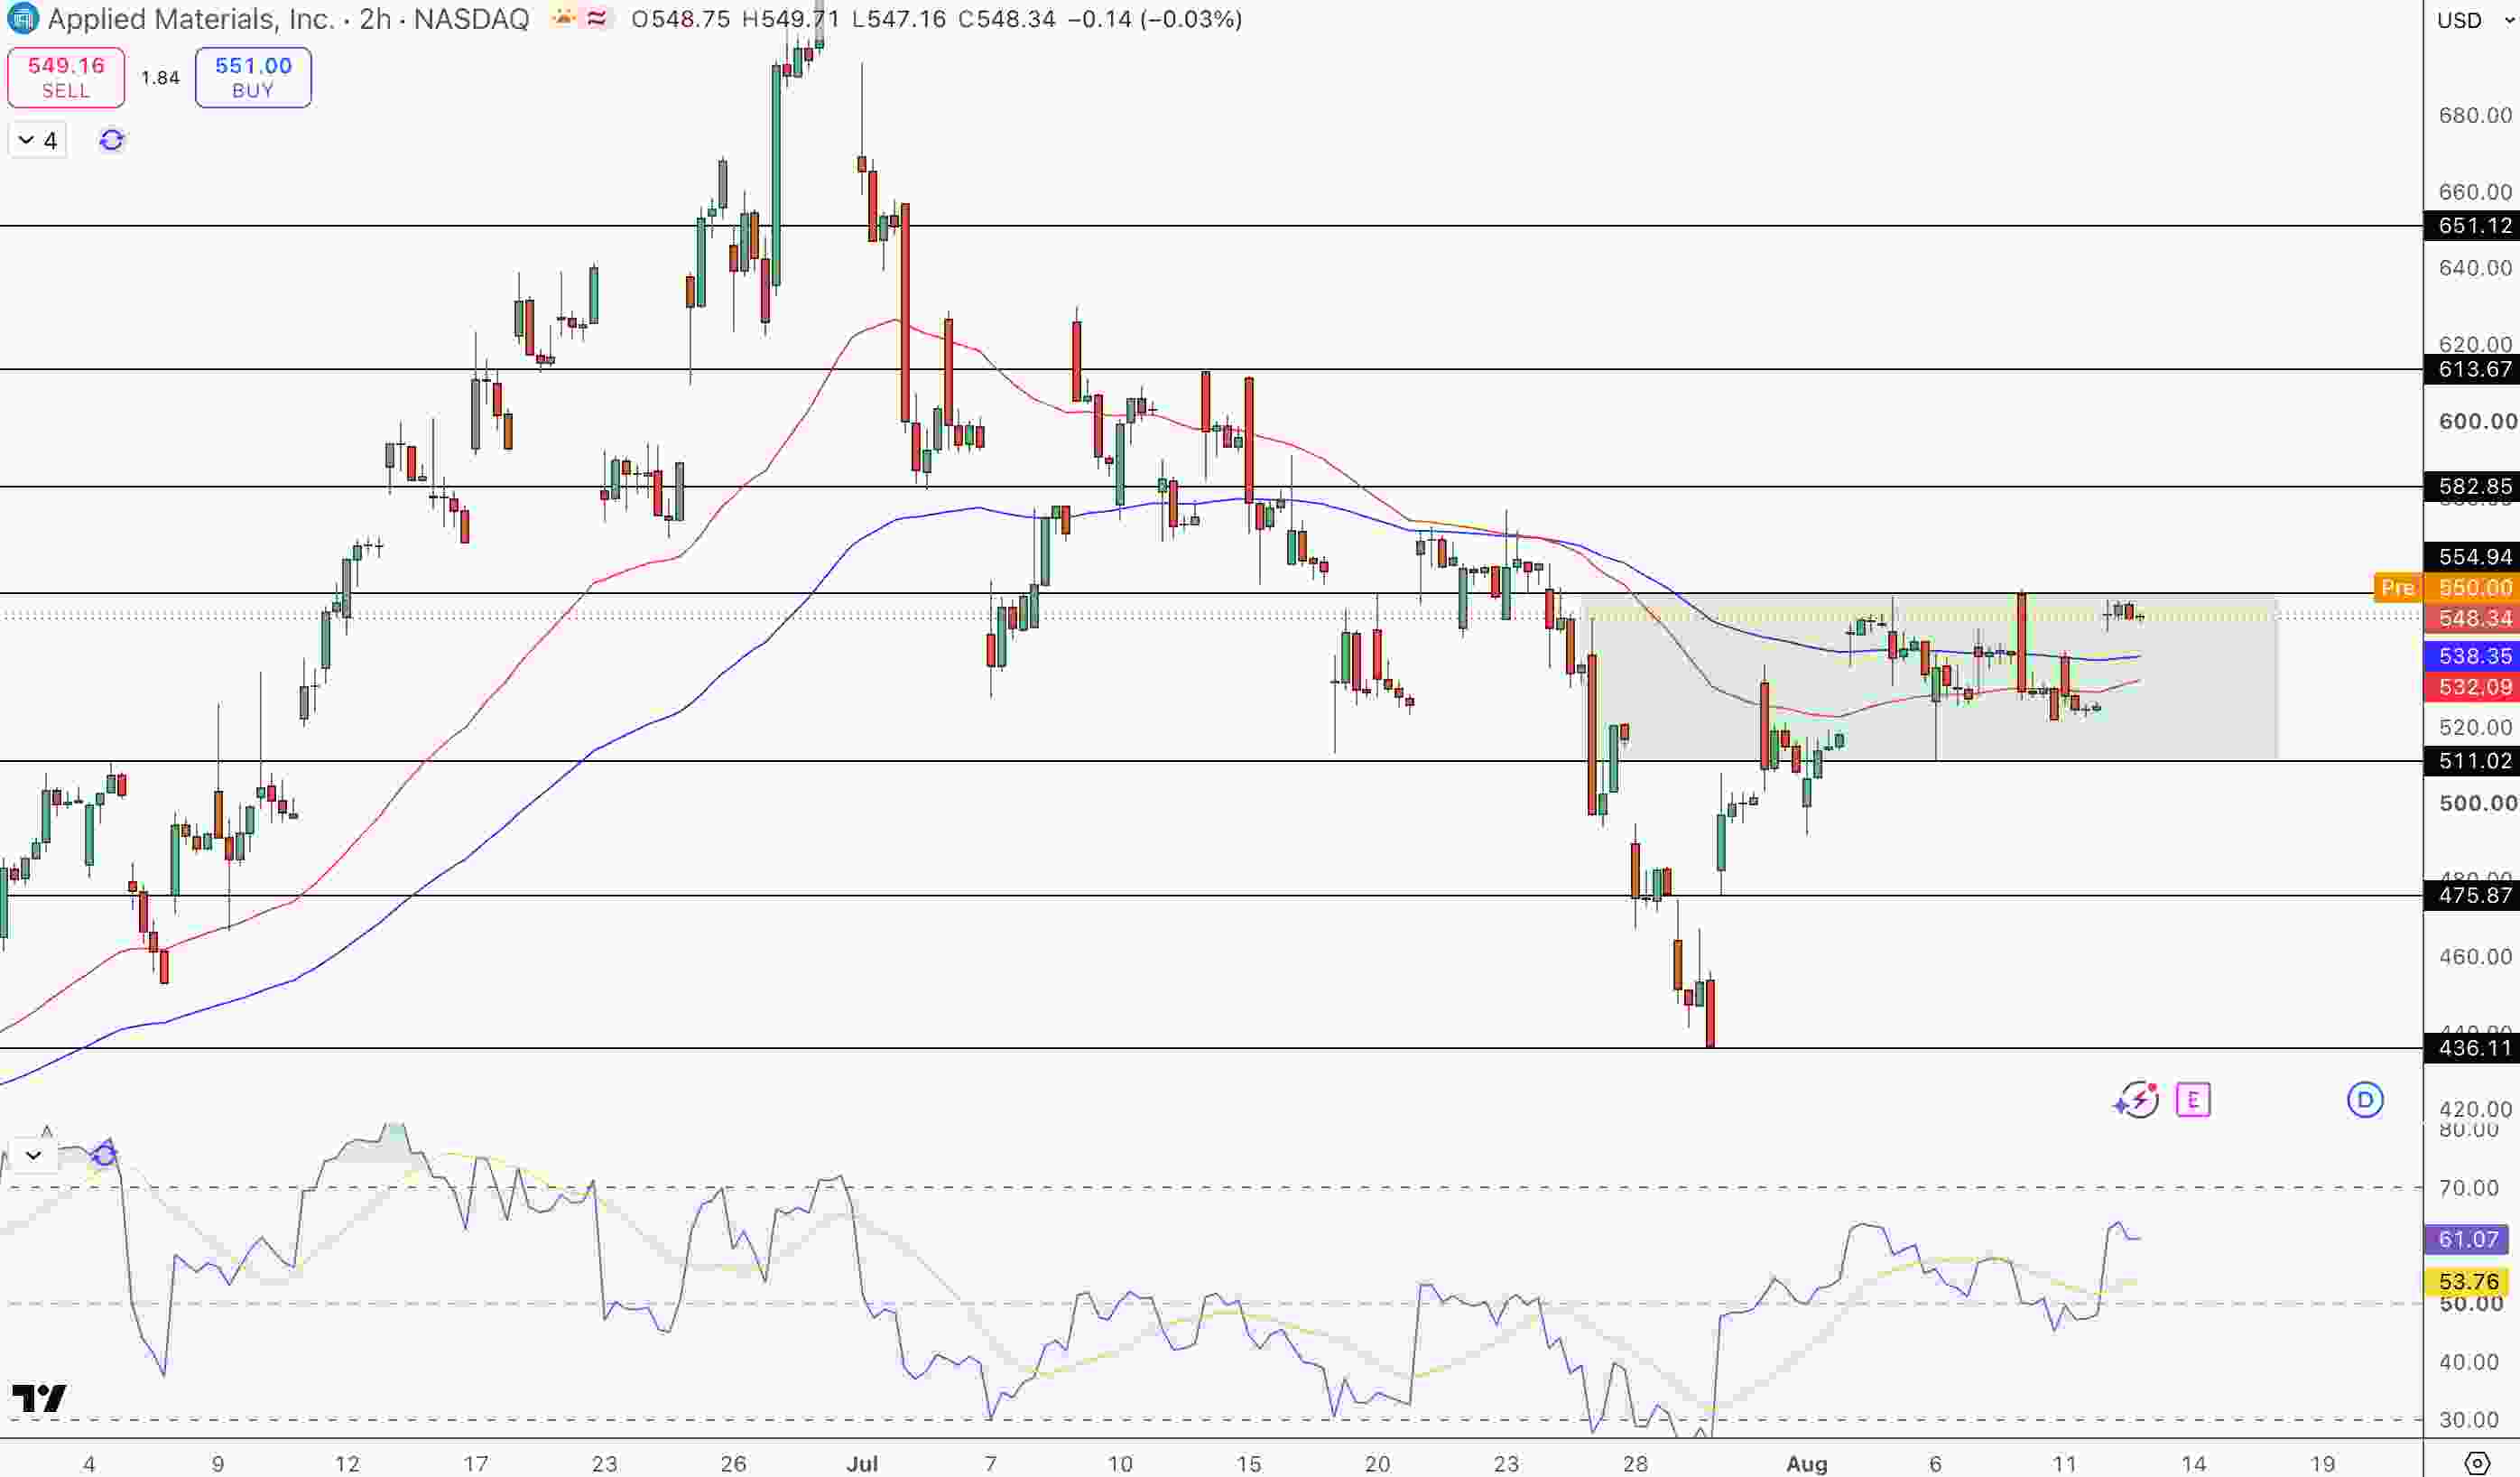
AMAT Price Chart - Source: Tradingview
Price still has room to run with $554.94 resistance breaking and hitting the overbought region. A break of this resistance will open a bull case beyond $582.85. The next significant levels of resistance after $582.85 stand at $613.67 and $651.12.
Strong support is also in place at $538.35 - $532.09 and at $511.02 (if the moving averages break). Dynamic support is below static support. The risk reward is favorable as the upside is capped at $554.94.
Key Levels (Aug 13, Earnings Tonight)
- Immediate breakout level: $554.94 (critical resistance, must break)
- Extended targets: $582.85, $613.67, $651.12 (if breakout extends)
- Moving average support cluster: $538.35, $532.09 (dynamic support)
- Late-July base support: $511.02
- Deeper support: $475.87
- Current price: $548.34 (approaching breakout)
- RSI: 61 (strong momentum, room to extend)
What to Watch in Tonight's Q3 Earnings (After Market Close, Aug 13)
Critical metrics:
(1) Did Q3 revenue hit $9.04B or did it beat?
(2) Where did the non-GAAP EPS come in at? Was it $3.36 or did it surpass?
(3) Where did free cash flow end up? Did it recover or did it continue to deteriorate?
(4) Did gross margins remain? Did they expand?
(5) Did Segment Performance reflect emerging growth within Semiconductor Systems?
(6) What were the management teams' expectations for Q4 & Fiscal Year 2027?
(7) Did management teams see strong 30%+ Equipment Growth?
(8) Color on customers from the hyperscalers and chipmakers? Did they see this as a multi-year, or 2026 only cycle?
The Bottom Line (Aug 13, Earnings Tonight)
Applied Materials is up 26% since July and testing the breakout level of $554.94. There are three strong fundamentals driving growth of 30%+ across Semiconductors, 50%+ within Advanced Packaging, and simultaneous AI/capacity/complexity across the business. Record growth was achieved in Q2 and showed strong revenue and margin growth.
AMAT is in an excellent technical spot above $532 to $538 and strong momentum with the RSI at 61. A break of $554.94 would push it up to $582 and beyond, while strong support is present at $538 and $511. A strong earnings report would break the consolidation of AMAT and push it toward higher valuations.
For tactical traders: $554.94 is the level to watch. A breakout above that would set the target at $582-$613. For investors: results tonight must confirm the AI equipment cycle is indeed multi-year and free cash flow has been achieved. With the valuation at 43.8x forward P/E, margin for error is very limited. Confirming 30%+ sustained growth and the recovery of FCF is required before more investment is justified. This is analysis, not investment advice.
Recommended Articles










Comments (0)
Click the $ button, enter the symbol, and select to link a stock, ETF, or other ticker.