


Apple Stock Price Forecast: Investment Banks Cut Price Targets After Earnings; How Shares Will Evolve After Falling Below $300?



AI Podcast


On July 31, Eastern Time, Apple shares declined to $300 following Q3 earnings, as supply constraints and foreign exchange headwinds dampened growth forecasts. Despite beating iPhone revenue expectations, the company reported slowing services growth and Chinese market weakness. Analysts revised price targets downward, citing margin pressure and uncertain catalysts like upcoming product launches and regulatory developments. Technically, the stock has breached critical support levels and moving averages, shifting the trend toward high-volatility risk. Investors should monitor the $300.81 Fibonacci level; failure to hold this threshold could signal further downside toward $288.92, while regaining $309.16 is necessary to stabilize sentiment.

TradingKey - On July 31, Eastern Time, Apple ( AAPL) fell to the $300 mark after announcing its third-quarter earnings. Its total market capitalization slid back to $4.4 trillion; however, just a few days earlier, Apple's market capitalization had just crowned the global rankings, reaching $5 trillion.
Although Apple's third-fiscal-quarter results were strong, with total revenue and iPhone revenue slightly exceeding expectations, performance in its services business and the Chinese market fell short of expectations.
More importantly, component shortages weighed on the tech giant's sales outlook. During the earnings call, Apple executives projected that the company's fourth-quarter fiscal revenue would grow by 9%-11%. The guidance range as a whole was below the 12.1% growth rate expected by analysts. Apple executives pointed out that they were primarily dragged down by two factors: foreign exchange and supply constraints.
Apple CFO Kevan expects that fourth-quarter fiscal iPhone revenue will be weighed down by supply constraints, with growth falling into a double-digit range of around 15%. Meanwhile, excluding a 2.5% foreign exchange impact, services growth is expected to be largely flat compared to the 12% in the third fiscal quarter.
Morgan Stanley lowered Apple's price target from $364 to $360 but maintained its "Overweight" rating. The institution noted that Apple faces headwinds in two key business areas. Services growth slowed to below 10% year-on-year for the first time since the June 2023 quarter, primarily due to foreign exchange fluctuations and slowing growth in the mobile gaming market. The median gross margin expectation, excluding tariff refunds, is 46.5%, which is 1 percentage point lower than Wall Street expectations, with memory costs accounting for over 100% of the quarter-on-quarter decline.
Morgan Stanley stated that Apple's stock price may remain weak before the next catalysts arrive, which include the launch (and pricing) of the iPhone 18 and foldable phones, the release of Siri AI, or international regulatory approvals.
Barclays, on the other hand, lowered Apple's price target from $253 to $245, maintaining an "Underweight" rating due to concerns over the weakness of the Chinese market and services business.
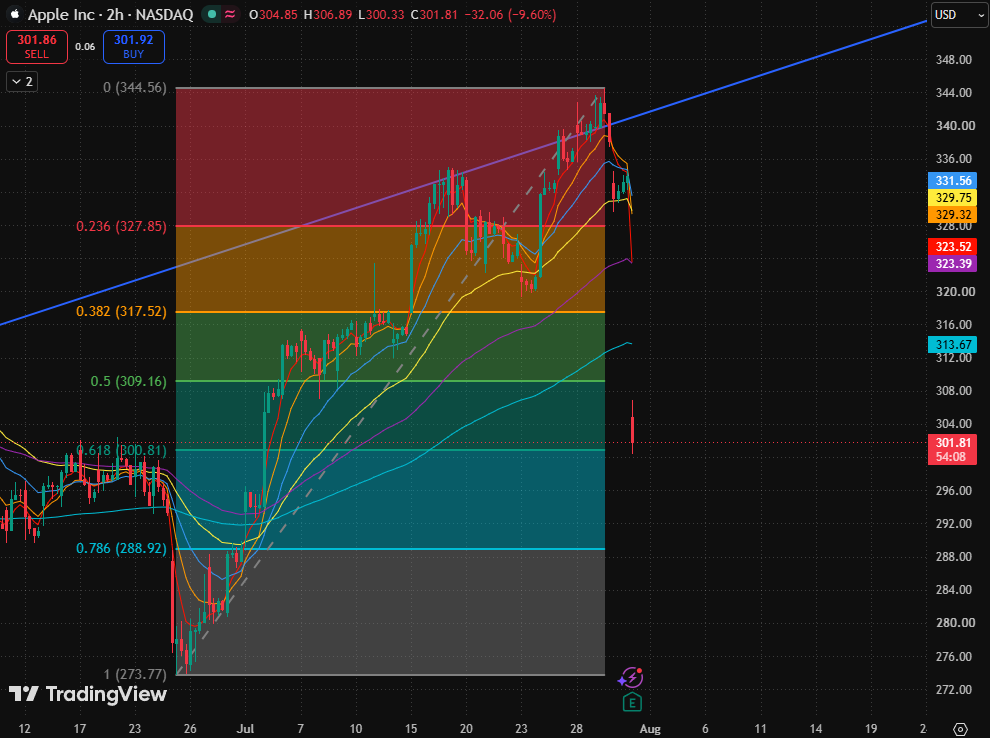
Apple 2-hour stock price chart, Source: TradingView
Looking at Apple's stock price chart, it has currently broken down significantly; the previous upward trendline has been breached, and the stock price has simultaneously lost multiple short- and medium-term moving averages. The short-term trend has turned from strong to weak, and the market has entered a risk-release phase of high volatility.
From the perspective of Fibonacci retracement levels, the stock price has consecutively broken below three key retracement levels: 0.236 ($327.85), 0.382 ($317.52), and 0.5 ($309.16), and has fallen back to near 0.618 ($300.81). Regarding moving averages, the price is significantly below the short- and medium-term moving averages in the $323–$332 range, with the moving average system shifting from previous bullish support to overhead resistance.
If the stock cannot quickly reclaim $309.16 after this sharp fall, it means the rebound structure that started from $273.77 faces the risk of being significantly weakened.
Currently, the primary level to watch is $300.81, which is the 0.618 Fibonacci retracement level and the most direct bull-bear line near the current price. If this level holds and a stabilizing candlestick appears, there is still a chance for a technical rebound.
If this position is lost, downside support will be watched in turn at $288.92 (the 0.786 retracement level) and $273.77 (the starting point of this rebound). On the upside, the first step is to see if $309.16 can be reclaimed, with further resistance levels situated at $317.52 and $327.85.
It should be noted that before reclaiming $309.16 and the short-term moving average area, any rebound should be viewed as a technical recovery after the breakdown rather than a trend reversal signal.
This content was translated using AI and reviewed for clarity. It is for informational purposes only.
Recommended Articles












Comments (0)
Click the $ button, enter the symbol, and select to link a stock, ETF, or other ticker.