


Apple Stock Price Forecast: What’s Next After Market Cap Surpasses Nvidia for World’s Top Spot



AI Podcast


As of Eastern Time July 27, Apple (AAPL) reached a record $4.96 trillion market capitalization, surpassing Nvidia. Options activity shows aggressive bullish positioning ahead of July 30 earnings, with implied volatility at 4%. Fundamentally, Apple is diversifying DRAM procurement to mitigate rising component costs. As capital rotates from volatile AI infrastructure plays toward stable assets, Apple’s cash-flow stability and limited AI capital expenditure attract investors seeking defensive positioning. Technically, the stock is in a bullish breakout phase, with $334.99 acting as a critical support level. Maintaining this threshold is essential to target the $344.65 extension.
TradingKey - On July 27, Eastern Time, Apple ( AAPL )'s stock price hit another record high, reaching a high of $339.57, with its total market capitalization reaching $4.96 trillion, once again surpassing Nvidia ( NVDA )'s market capitalization of $4.8 trillion.
Apple is reportedly set to release its latest quarterly results after the U.S. market close on July 30. According to media reports, big money in the options market is aggressively buying in-the-money call options, while speculative money is betting that the stock price will break its record high before this Friday. Meanwhile, the post-earnings volatility implied by options pricing is close to 4%, far exceeding the historical average volatility of about 1% over the past year.
According to SpotGamma data, the total premium traded for Apple options last Friday reached $590 million, with $442 million associated with call options. ThinkOrSwim data also showed that about 560,000 call option contracts were traded on that day, compared to only about 332,000 put option contracts.
Looking at the distribution of open interest for options expiring this Friday, according to BarChart data, the largest open interest is at the $320 strike price, with about 13,000 call contracts and about 5,000 put contracts. This structure indicates that even if the earnings report fails to trigger a significant rally, the market remains highly confident that last week's low can hold.
It is worth noting that Apple has recently begun testing DRAM chips from Chinese memory manufacturer ChangXin for electronic products sold in China. This could alleviate the cost pressure on Apple caused by rising memory chip prices. According to estimates by research firm TechInsights, the memory cost of a single iPhone 18 Pro has soared from $39 in the previous generation to $145, while the flash memory cost has risen from $13 to $51.
On the other hand, as deep-seated market concerns over the AI infrastructure boom heat up, the uncertainty of returns on the data center AI chip 'arms race' continues to be highlighted. The attractiveness of highly valued, highly volatile pure-play AI computing plays has declined, and capital is starting to rotate from the computing sector into stable assets with higher certainty. With its stable business model and abundant cash flow, Apple has gradually become a preferred target for capital hedging against AI investments.
Nigam Arora, founder and author of The Arora Report newsletter, said, "I think there is a high probability that Apple will help stabilize the market this week. Investors view Apple as a defensive stock because, compared to several of its peers, Apple has not spent hundreds of billions of dollars betting on AI capital expenditures."
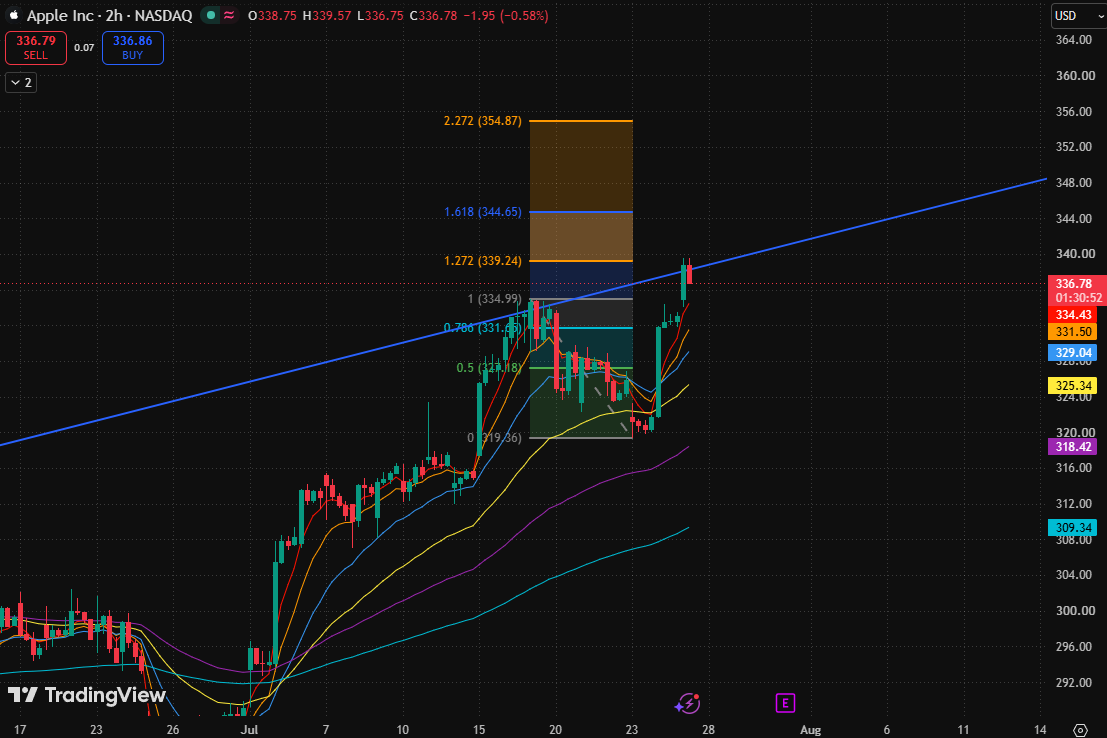
Apple 2-Hour Stock Chart, Source: TradingView
Looking at the Apple stock chart, the price has officially broken through the former resistance level of the previous high ($334.99). From the interim low of $319.35 on July 23 to today, it took only three trading days to rebound over 6%, and the overall upward trend has transitioned to a bullish breakout stage.
Currently, the stock price is pulling back slightly after hitting a new high, which is a typical 'post-breakout minor consolidation' pattern, indicating that the price has reached a preliminary equilibrium at a new level, and both bulls and bears are competing for the initiative on the next direction.
All moving averages currently maintain an upward trajectory, presenting a perfect bullish alignment. The short-term MA5, MA10, and MA20 lines are in the $329-$334 price range, forming a strong support level.
From the Fibonacci chart, $334.99 is currently the most critical support level, which has just transitioned from a previous resistance level into support. This is key to determining whether the breakout is 'valid' or 'fake'.
Simply put, Apple needs to firmly hold above $334.99, which could open up upside potential toward the Fibonacci 1.618 extension level ($344.65). If it fails to break through $339.24, it may pull back to find support in the cluster of moving averages below. The bulls may enter a 'high-level consolidation' at the current level, contrasting with the expectation of a strong rally post-breakout.
This content was translated using AI and reviewed for clarity. It is for informational purposes only.
Recommended Articles










Comments (0)
Click the $ button, enter the symbol, and select to link a stock, ETF, or other ticker.