


GE Aerospace (GE) Beats Earnings: Why the Stock Plunged Anyway



AI Podcast


GE Aerospace delivered strong Q2 2026 results, with revenue up 31% to $13.35 billion and adjusted EPS of $2.02, exceeding expectations. The company raised its full-year guidance across all metrics. Despite these fundamentals, shares fell due to an order growth deceleration to 17%, down from 87% in Q1. Investors are weighing whether this reflects a cooling demand cycle or post-peak normalization. With a $210 billion backlog, the firm remains focused on execution. Technically, the stock is testing support near $344; maintaining these levels is critical to sustaining the broader uptrend and targeting prior highs.
TradingKey -Following a 4-6% slide after the second quarter 2026 report on July 16, GE Aerospace (NYSE: GE) is now finding support around the trendline and Fibonacci levels on the daily time frame. The earnings report was stronger than anticipated on the top and bottom line, along with stronger than anticipated free cash flow, but investors were disappointed that orders did not come close to matching the double digit growth rate of first quarter orders. Revenue for the second quarter was $13.35 billion, up 31% year-over-year.
Adjusted earnings were $2.02, an increase of 8.6% above consensus of $1.86. Free cash flow came in at $3.03 billion, representing an increase of 43%. Guidance was raised on full-year earnings to a range of $7.65 to $7.85 per share. Orders rose a far lower 17% to $16.5 billion from the previous quarter's orders growth of 87%. The nearest Fibonacci and moving average support at $360.35 is a confluence of the 38.2% level at $343.96 and the 50-day moving average at $339.80. The relative strength index (RSI) at 45 is neutral.
The Beat Was Real, Here Is Why the Stock Fell Anyway
GE Aerospace Q2 2026 was a quarter of significant outperformance on the key business metrics. Revenue increased 31% year-over-year to beat Zacks revenue estimates by $1.44 billion ($13.35 billion versus $11.91 billion). Adjusted EPS was $2.02, beating Zacks consensus of $1.86 by 8.6%, a 22% year-over-year increase. Free cash flow was $3.03 billion, up 43%, with operating cash flow at $3.26 billion, up 39%.
Commercial Engines and Services grew 27% to $9.73 billion while Defence and Propulsion Technologies grew 16% to $3.44 billion. GE raised full year adjusted EPS from $7.10-$7.40 to $7.65-$7.85, raised operating profit estimates from $9.85-$10.25 billion to $10.55 to $10.75 billion and raised full year free cash flow estimates from $8.0-$8.4 billion to $8.9-$9.2 billion. All metrics exceeded expectations, all ranges were raised.
The stock fell on one number. Q2 2026 orders came in at $16.5 billion, up 17% compared to Q1's orders of $23.0 billion up 87%. The deceleration from 87% to 17% in orders in a single quarter is the sort of change in direction that makes people wonder if the very strong demand cycle that drove GE up 43% in one year is slowing or normalising.
GE CEO Larry Culp stated on the call that management remained focused on converting its $210+ billion backlog. Q2 showed a 20% sequential increase in spare parts delinquencies, suggesting that backlog and supply chain is a constraint on how much demand GE can fill. The stock hit an all time high of $382.97 earlier in July before this report. Now at $360.35, investors are trying to determine if this was just a one quarter normalisation to follow the massive Q1 orders or the beginning of a slowing down of demand for GE Aerospace.
The $170 Billion Services Backlog and Why It Changes the Risk Profile
Of all the structural realities governing GE Aerospace, the critical one is that its $210 billion order backlog is primarily driven by services, not new engine sales, with the former accounting for around $170 billion of the total. Service revenue for Q2 accelerated to +26% YoY on the back of internal shop visit growth up 25% and more than 25% higher spare-parts revenue.
Airlines cannot put off service indefinitely, especially for the critical maintenance and servicing of engines. If they do, the airlines are not going to be able to fly. While the durability enhancement for the LEAP-1B engine, which was announced in Q2 and subsequently certified, and is expected to increase the average time between service roughly two-fold in commercial airplanes and therefore reduce time on wing, is very good news for airline customers, it will change the pattern of future service revenue. If engines are not serviced as frequently, then shop visits that were previously forecasted won’t happen.
FLIGHT DECK, the GE digital manufacturing operating system, is driving better supply chain performance with a 60% reduction in production lead times for critical engine parts for F110 and CFM56 final assembly reduced by 50%. For the LEAP, production deliveries were up 24% for Q2 and 41% YoY for H1.
The recently-announced $1B additional investment, including $200M to ramp LEAP capacity, $275M in defense engine production and another $100M+ for the external supplier base that is coming from the GE US factory by 2026 are the investments that will define the speed that GE can ramp the 210B of backlog it currently has to deliveries. Jefferies has the street-high target $455. RBC at $400 and consensus from 19 Buy and 2 Sell analysts is ~$366-$370.
GE Technical Setup, Trendline and 38.2% Fib at $344, RSI 45, Key Levels
GE at $360.35 is approaching the 38.2% fib at $343.96 on the daily chart (along with the long-term trendline), where there will be a key support test. This is a bit lower than the 50-day EMA at $339.80 which will be the next level of support. The RSI reading is neutral (near 45 levels) without a sell signal. Expecting a bounce back from the $344 to $340 area, which is projected to be $358.60 with $382.80 next (the prior high on the daily chart).
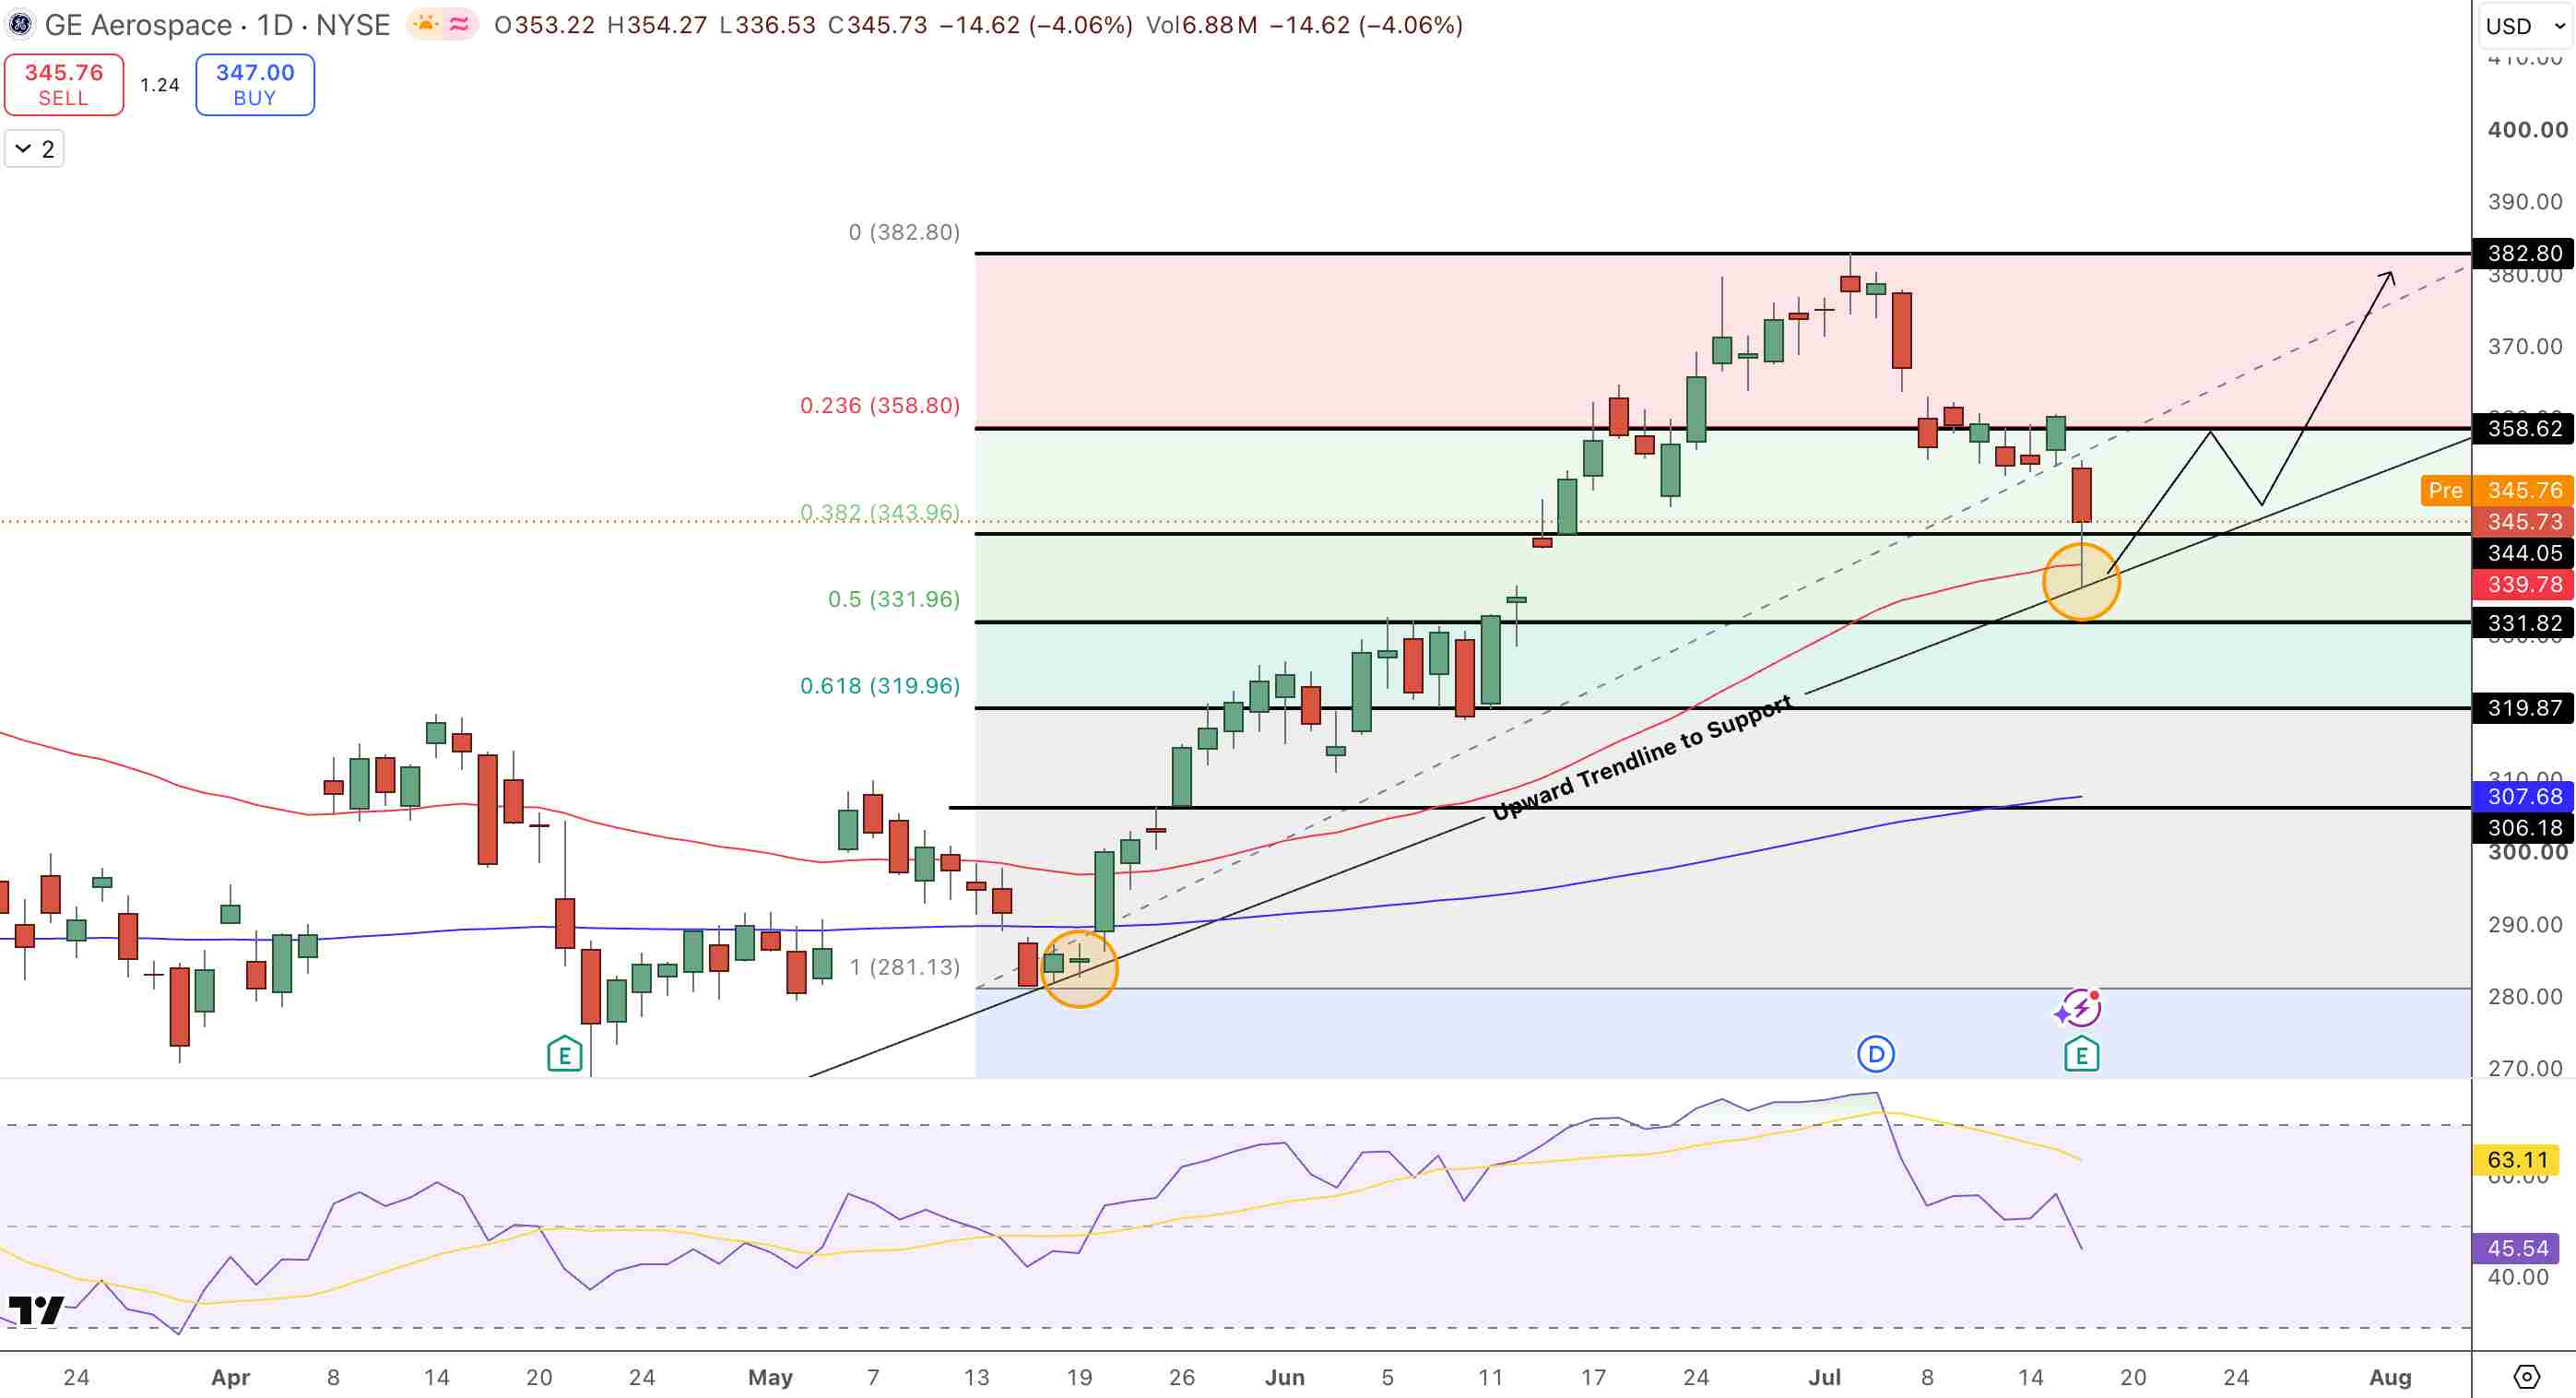
GE Aerospace (GE) Price Chart - Source: Tradingview
If there are no major negative developments and we are below $339.80, this would put us in contact with the 50% Fib at $331.80 and $319.90. As long as GE holds support within the $344 to $340 levels, we can view the pullback as just a normal correction within the overall uptrend.
Q2 Actuals:
- Revenue: $13.35B (+31% YoY).
- Adj EPS: $2.02 vs $1.86 est (+8.6%).
- FCF: +43% to $3.03B.
FY2026 Guidance:
- Adj EPS: $7.65 to $7.85.
- Op profit: $10.55 to $10.75B.
- FCF: $8.9 to $9.2B.
Order Concern: $16.5B orders (+17%) vs Q1’s $23.0B (+87%). Deceleration drove the selloff.
Backlog: $210B total. $170B in commercial services. LEAP deliveries +41% H1 YoY.
Support: 38.2% Fib at $343.96 + 50-day EMA at $339.80. Below: $331.80 and $319.90.
Targets: $358.60 on rebound, then $382.80 prior high and $455.
Bottom Line
GE posted Q2 2026 revenue growth of 31% year-over-year (YoY) to $13.35 billion, adjusted EPS of $2.02 which was 8.6% ahead of expectations, and free cash flow of 43%, in addition to raising all full-year guidance ranges. The stock dropped 4% because while the earnings and guidance were fantastic, the slowdown in order growth from 87% YoY in the prior quarter to only 17% YoY in the current quarter has led investors to conclude that the order growth cycle may be winding down to more normal levels.
The business looks strong on its own merits, but we are going to have to be patient and let the market decide if the order growth deceleration in Q2 2026 marks the beginning of a broader trend or was simply a normalisation after Q1 2026’s incredible performance.
Recommended Articles











Comments (0)
Click the $ button, enter the symbol, and select to link a stock, ETF, or other ticker.