

Microsoft Stock Price Trend Forecast: Stock Price Fell Over 20% Cumulatively in June, $345 Becomes Key Bull-Bear Pivot Point


AI Podcast
Microsoft (MSFT) closed at $352.83 on June 25 Eastern Time, marking a 3.46% decline. The stock has dropped 21.64% since June, pressured by a bearish double-top pattern and investor concerns over the company's $190 billion fiscal 2026 capex guidance. Having breached its March low, the stock’s technical structure remains weak. Current momentum favors further downside toward the $345 support level; a failure here risks a slide to the $300 range. Conversely, holding $345 may facilitate a technical rebound toward $400, provided market sentiment stabilizes amid ongoing AI investment scrutiny.

TradingKey - As of the close on June 25 Eastern Time, Microsoft ( MSFT) shares extended their recent downward trend intraday, closing 3.46% lower at $352.83. Since June, Microsoft's stock price has steadily declined, with a cumulative drop of 21.64%, indicating that investor sentiment remains bearish. Furthermore, as the stock broke below its March low, market bearishness was further amplified. In pre-market trading today, the stock rose slightly by 1%, suggesting some support from below.
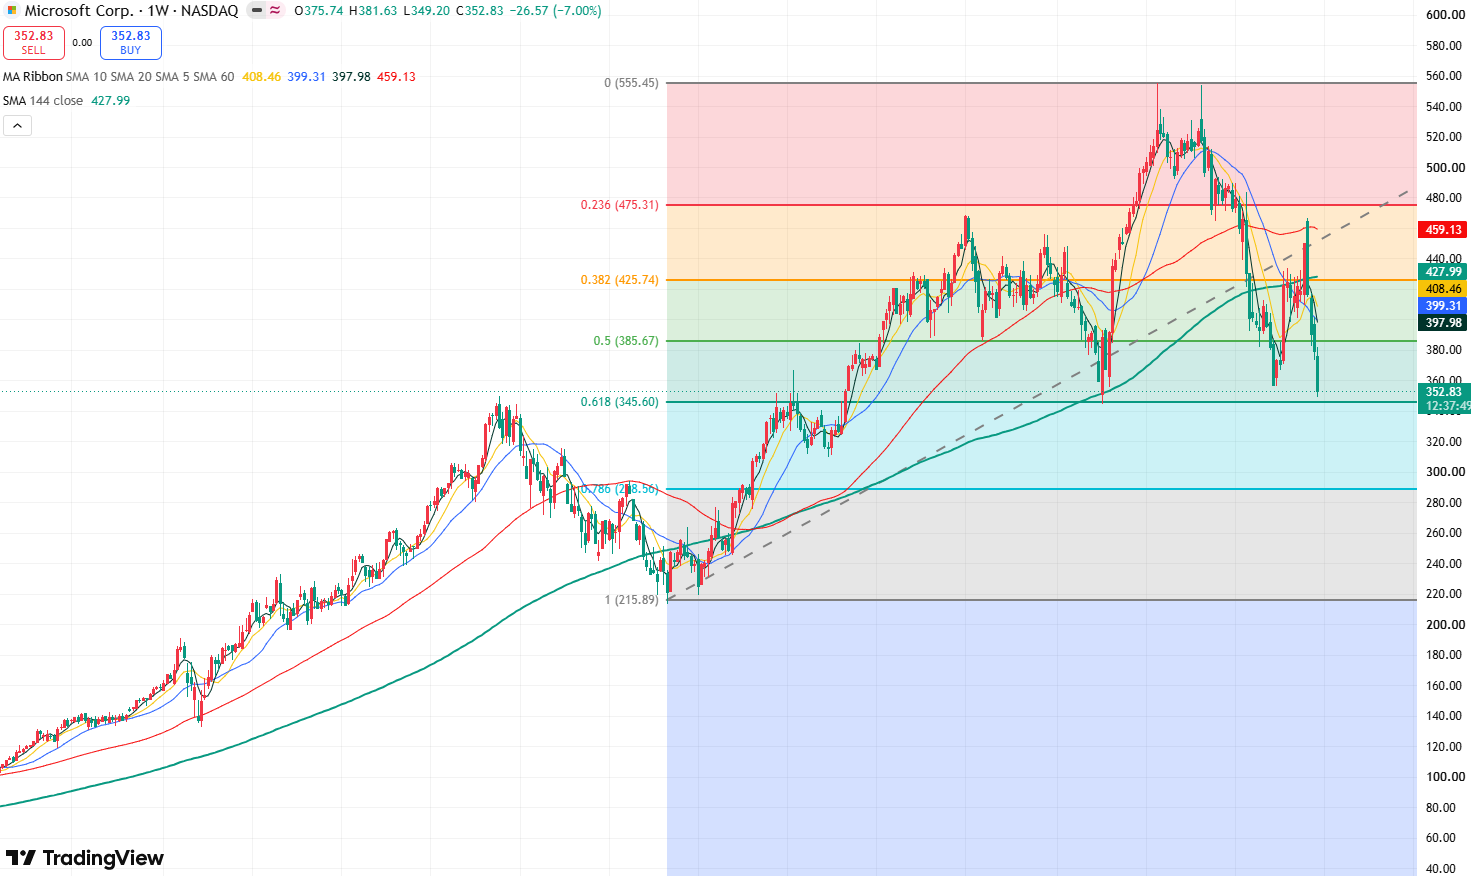
Microsoft Stock Weekly Chart, Source: TradingView
Looking at Microsoft's weekly stock chart, the price attempted to break above the $555 resistance level twice in July and October 2025 but failed both times. Meanwhile, the candlestick pattern formed a double top, significantly boosting bearish momentum and driving the stock continuously lower to a low of $356.28—a correction of approximately 35.8% from its all-time high, indicating a weak overall structure.
Since March this year, driven by the strong AI rally, Microsoft's stock price once rebounded to $466.32. Notably, Microsoft's capex guidance for fiscal year 2026 has risen to approximately $190 billion. Fueled by recent market concerns over AI spending, Microsoft's stock is on track to record its fourth consecutive weekly decline this week.
Currently, Microsoft's stock price broke below its March low of $356.28 on Thursday, significantly strengthening bearish momentum. The stock is likely to test the key support level of $345. If this level fails to hold, it will open up further downside toward $300-$288, and a continued decline could see the price drop back toward around $215.
Conversely, if the stock holds above $345 this week, it may trigger a short-term technical rebound. The primary target for the rebound would be the $400 mark, and if the upward movement continues, it could test the $425 resistance level.
This content was translated using AI and reviewed for clarity. It is for informational purposes only.
Recommended Articles


Comments (0)
Click the $ button, enter the symbol, and select to link a stock, ETF, or other ticker.