


SpaceX IPO Makes History, But Breaks Below Offer Price a Month Later, What Should Investors Watch in the Coming Months?



AI Podcast


SpaceX’s stock has faced significant pressure, dropping over 40% from its peak to breach the $135 IPO price by mid-July. The decline reflects waning investor sentiment, high valuations, and looming lockup expirations that threaten to expand supply. With a forward price-to-sales ratio exceeding 30x, the company faces fundamental skepticism regarding its $1.78 trillion market cap and xAI’s profitability. Investors should monitor Q2 earnings, specifically Starlink’s ARPU and user growth, alongside insider selling volume. While current valuations near $131 offer improved risk-reward, significant institutional divergence persists regarding long-term commercialization milestones for Starship and regulatory stability.

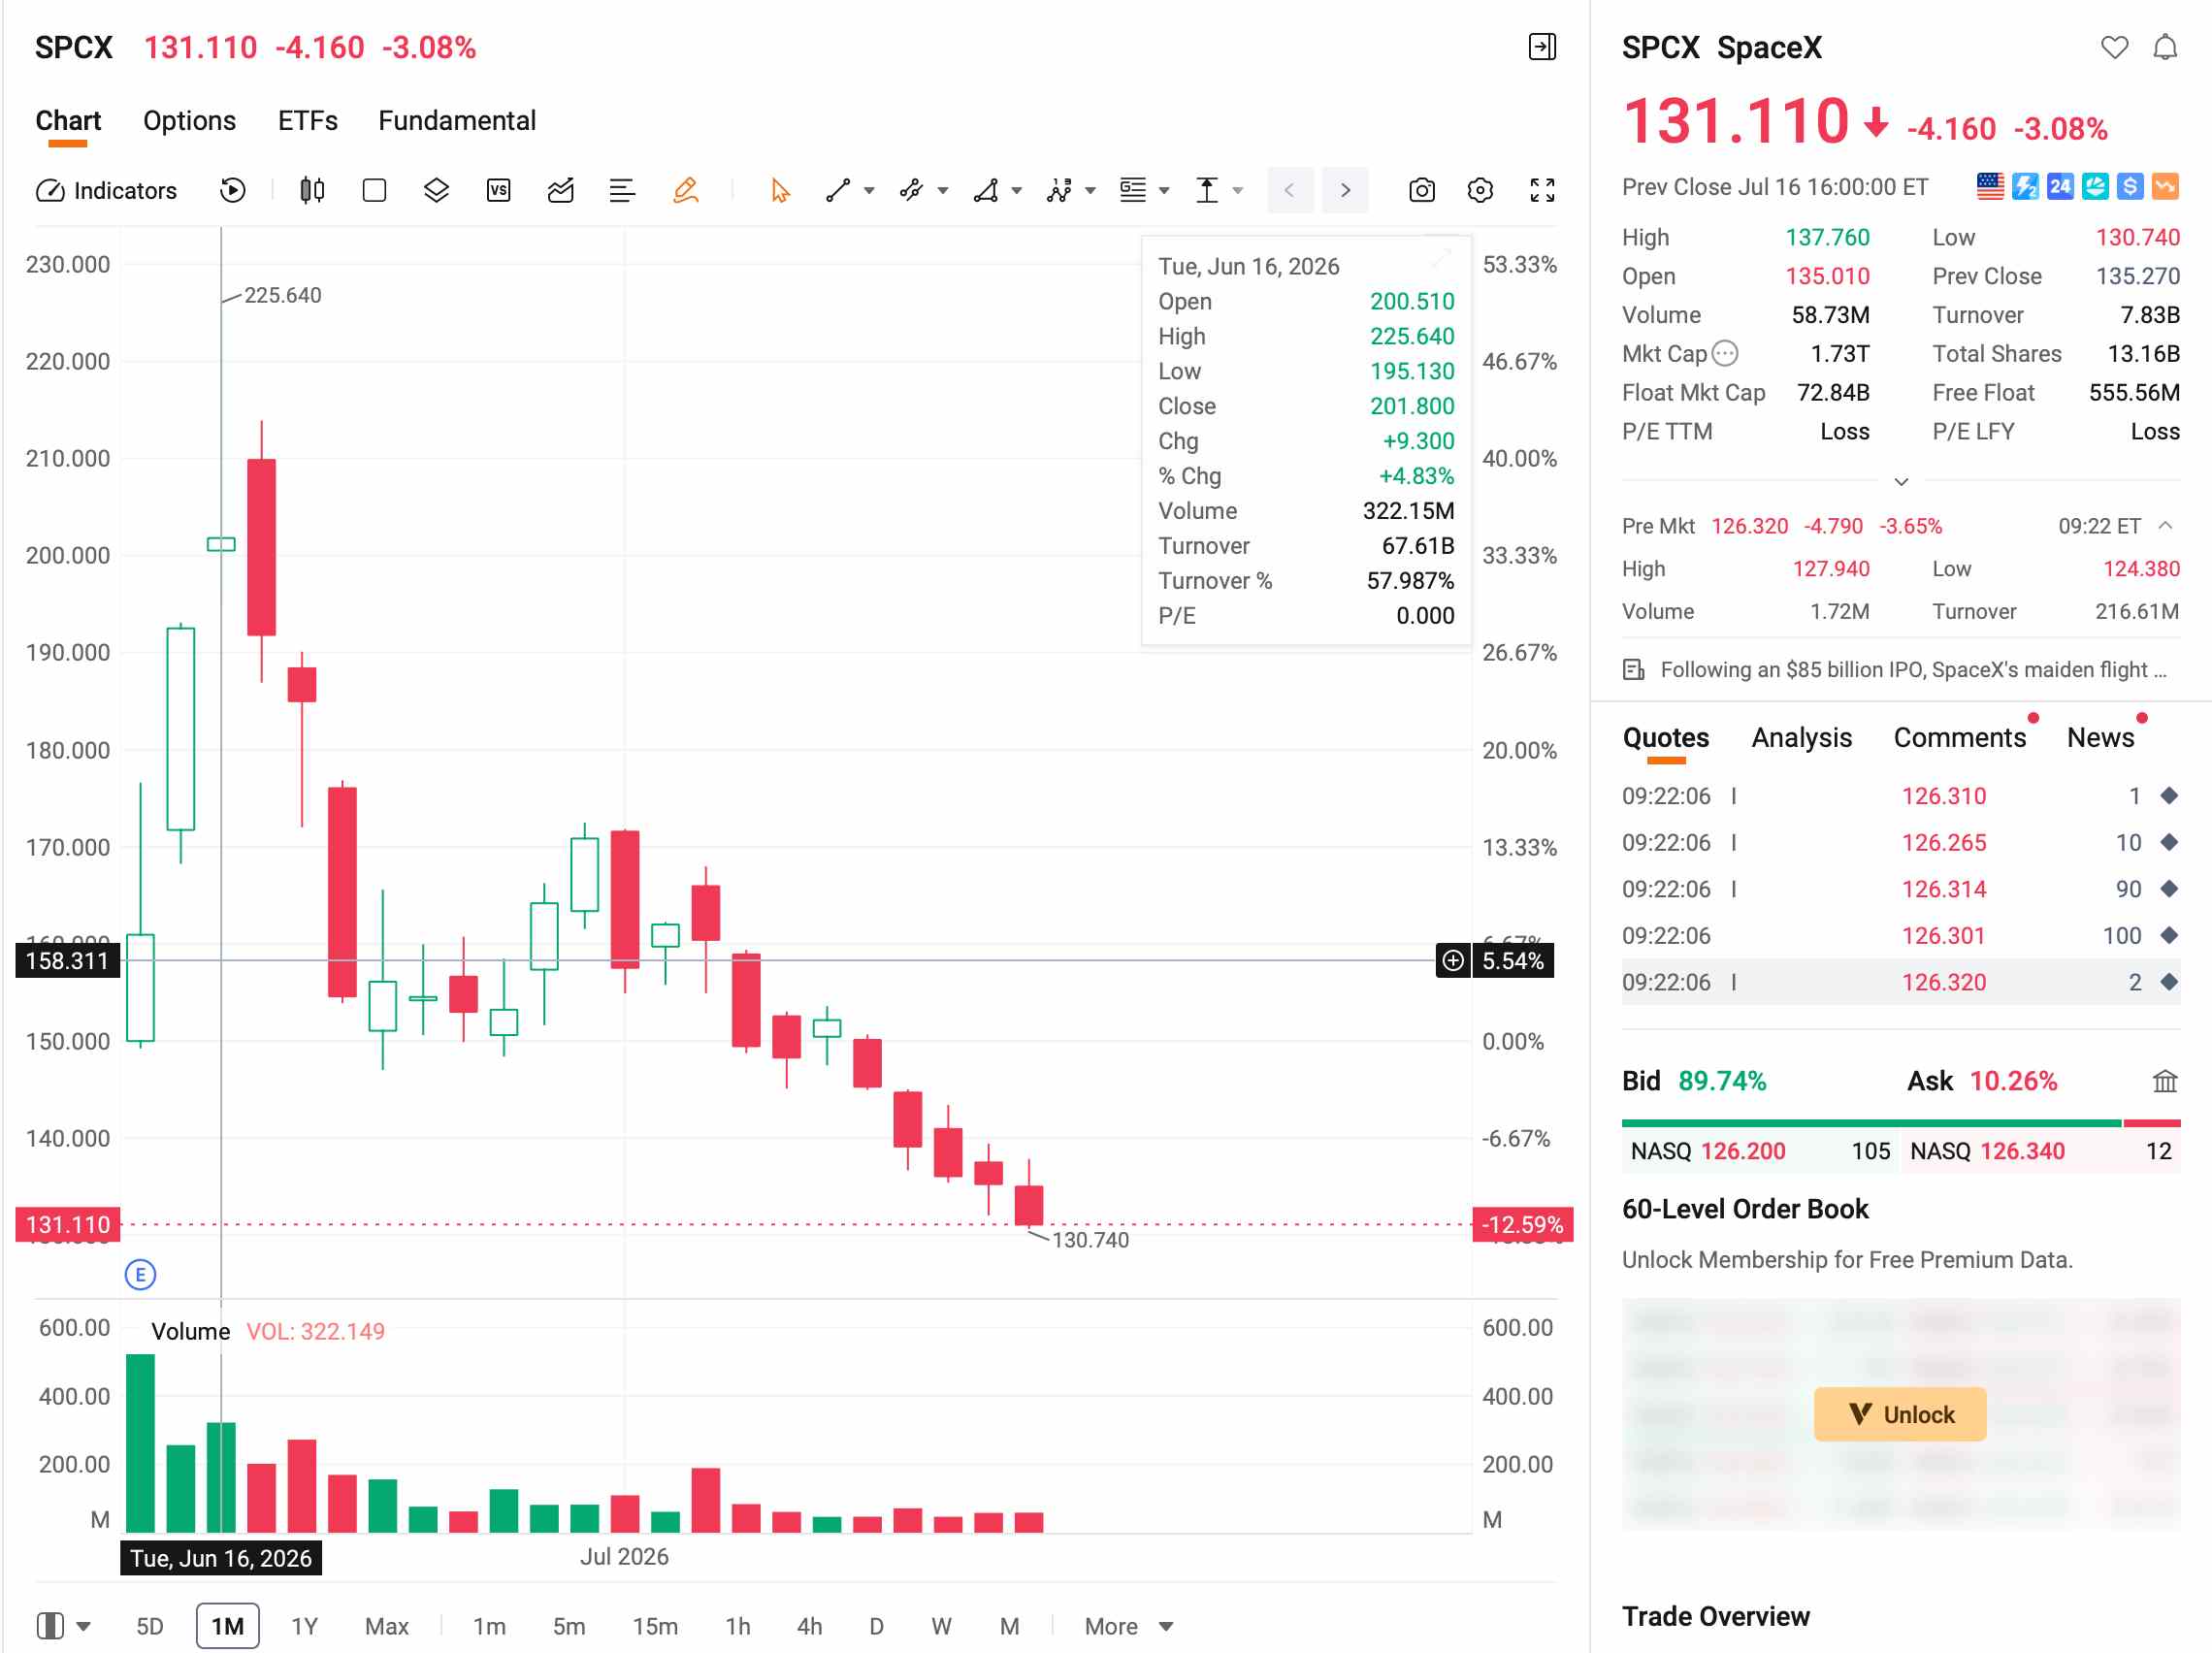
TradingKey - On June 12, 2026, Eastern Time, SpaceX ( SPCX) went public on Nasdaq at $135 per share, with a base offering size of approximately $75 billion, setting a new global IPO record.
During its first week of trading, the stock price was pushed to an all-time high of $225.64, with its market capitalization briefly surpassing $2.6 trillion. However, the frenzy did not last. Over the following four weeks, the stock price continued to pull back, falling below its offering price intraday for the first time on July 15, hitting a low of $132.28 and closing at $135.27. From its peak, the pullback exceeded 40%.
[Source: Futu]
Why SpaceX Stock Price Would Break Below Offer Price?
SpaceX's stock price went from frenzy to falling below its IPO price within a month, mainly due to investor concerns over lockup expiration pressure and high valuation levels.
Regarding lockup expiration pressure, in the early stages of SpaceX's listing, its free-float shares accounted for less than 5% of the total share capital, with approximately 95% locked up. Meanwhile, SpaceX was quickly included in the Nasdaq 100 Index after its listing, forcing passive funds to build positions amid an extreme shortage of circulating shares, which drove up the stock price.
This structure is currently reversing. SpaceX has set up a tiered lockup expiration plan containing 15 independent release dates, arranged as follows:
Lockup Expiration Timeline | Percentage Released |
Two trading days after the release of Q2 financial results (expected early to mid-August) | 20% |
Day 70 post-IPO (approx. August 21) | 7% |
Day 90 post-IPO (approx. September 10) | 7% |
Day 105 post-IPO | 7% |
Day 120 post-IPO | 7% |
Day 135 post-IPO | 7% |
After the release of Q3 financial results | 28% |
Day 366 (expected June 2027) | Elon Musk's shares (approx. 42%) |
According to estimates by 22V Research strategists, multiple lockup expiration windows between August and September could allow insiders to sell up to 44% of the shares. However, lockup expiration does not equate to inevitable divestment; insiders' disposal decisions depend on their assessment of the relationship between the current stock price and the company's intrinsic value.
Short-selling momentum is also gathering at the same time. According to a report by a third-party data provider, as of July 10, approximately 28% of the free float had been lent out for short selling. However, a high short interest can also trigger a short squeeze rally when positive news emerges.
From a valuation perspective, SpaceX's current forward price-to-sales ratio exceeds 30x, ranking among the top constituents of the Nasdaq 100 Index, only slightly lower than Palantir Technologies Inc. ( PLTR ), which is at approximately 66x. Conservative views suggest that this level is unlikely to provide a sufficient margin of safety for the stock price.
First, there is a severe decoupling between valuation and fundamentals. MoffettNathanson analyst Julie Zhu pointed out that SpaceX currently lacks a credible financial model to support its valuation of approximately $2 trillion. SpaceX's net loss for the full year of 2025 reached $4.937 billion, and its net loss for the first quarter of 2026 was $4.276 billion. The xAI business (operating loss of $6.36 billion in 2025) dragged down the already profitable Starlink (operating profit of $4.423 billion in 2025).
Although xAI has signed a monthly compute rental agreement of $1.25 billion with Anthropic, generating annualized revenue of approximately $15 billion, the contract can be terminated by either party with 90 days' prior notice. Whether this compute rental model is sustainable depends on the stability of compute demand.
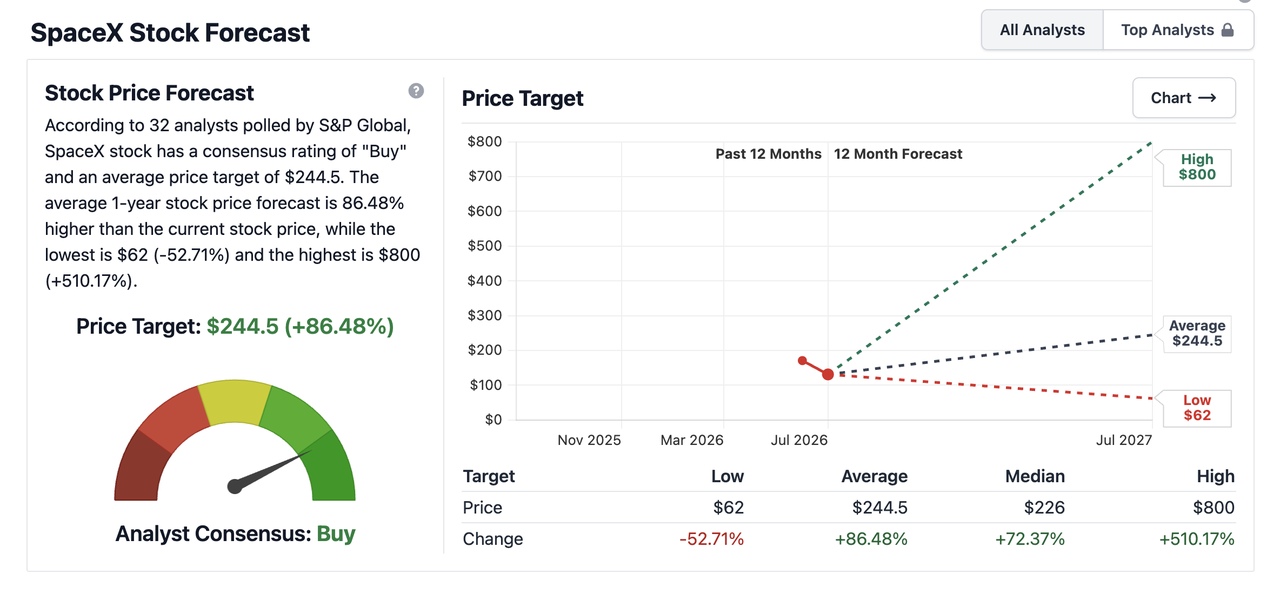
Second, institutional divergence is massive. After SpaceX's IPO quiet period ended on July 6, multiple institutions initiated coverage of SpaceX. Currently, over 80% of analysts recommend a Buy, but the range of price targets is extremely wide. As of July 17, according to data compiled by Stock Analysis, the average one-year price target given by 32 analysts for SpaceX was $244.5.
[Source: Official website of Stock Analysis]
Summary of price targets from mainstream institutions:
Institution | Rating | Price Target | Core Logic |
Raymond James | Strong Buy | $800 | Betting on Starship cutting launch costs by over 99% |
Morgan Stanley | Overweight | $300 | Scenario-weighted SOTP (Bull $600 / Bear $75) |
Goldman Sachs | Buy | $205 | Solid valuation + growth premium |
Bank of America | Buy | $235 | Optimistic about low-cost space transportation driving new applications such as orbital computing |
Deutsche Bank | Buy | $255 | Describing SpaceX as representing "civilization-level ambition" |
MoffettNathanson | Neutral | $131 | Risks discounted, conservative pricing |
The focus of institutional disagreement lies in the success probability of Starship. Raymond James's $800 price target implicitly assumes Starship will achieve weekly commercial launches by 2028; meanwhile, conservatives believe that Starship's R&D will see continued budget overruns and commercialization will be delayed until after 2030.
In addition, regulatory risks should not be overlooked. Much of SpaceX's revenue relies on contracts from NASA and the Pentagon, but the U.S. government's relationship with Musk has not always been stable. In July 2025, after Trump's relationship with Musk ruptured, the government launched a review of SpaceX's federal contracts. Although most contracts are difficult to cancel due to its technological monopoly, some contracts still face the risk of ongoing review.
What Investors Should Watch in the Coming Months
The first batch of 20% shares is expected to be unlocked two trading days after the Q2 earnings report (the market generally expects this to be in early-to-mid August), with August to September being the window where lock-up expiration pressure is most concentrated.
Metrics to watch | Positive signals | Warning signals |
First-week sales volume after lock-up expiration as a percentage of free float | <3% (indicating insiders are reluctant to sell) | >5% (indicating a concentrated sell-off is occurring) |
Stock price performance post-lock-up | Trading sideways or stabilizing after a slight decline (indicating support from buyers) | Continuous decline on high volume (indicating a supply-demand imbalance) |
Nature of insider selling announcements | Sporadic, small-scale selling (normal profit-taking) | Simultaneous large-scale selling by multiple executives (a signal of a lack of confidence) |
In addition, the market is also waiting to see if the August Q2 earnings report validates Starlink's growth trajectory. Starlink's Q1 2026 results were solid, with revenue of $3.257 billion and profit of $1.188 billion. As of the end of March, it had over 10.3 million users, covering 164 countries and regions. However, the underlying concern lies in the continuous decline of average revenue per user (ARPU), which dropped from $99 in fiscal year 2023 to $66 in Q1 2026. While $66 itself is not a crisis, the following scenarios require high vigilance:
Q2 earnings data scenarios | Implications | Impact on valuation |
ARPU ≥ $65 and Users ≥ 11.5 million | Price-for-volume strategy continues to yield results | The aforementioned 900 billion base valuation framework is validated, bolstering support |
ARPU of $60-$65 but Users ≥ 12 million | The logic of trading price for volume remains intact | No immediate adjustment to the valuation framework is needed, but Q3 data requires continuous monitoring |
ARPU < $60 and Users < 11 million | Simultaneous declines in price and volume, challenging the economies-of-scale narrative | The 900 billion valuation framework would need to be revised downward, and the fair value could be cut by 20%-30% from $135 |
Is SpaceX Upside Momentum Still There?
Currently, the triple forces driving the post-IPO surge—extremely low float, passive index buying, and the retail frenzy—have all been fully digested. Lock-up expirations for insiders are gradually expanding the float, while new buying momentum remains unclear.
Calculated using a sum-of-the-parts valuation: Starlink is worth approximately $600 billion to $800 billion, rocket launches about $100 billion, and xAI's confirmed computing power revenue is estimated at approximately $75 billion to $120 billion based on a 5-8x price-to-sales multiple. The combined median valuation is approximately $900 billion, corresponding to about $69 per share.
Within the current $1.78 trillion market capitalization, the premium paid by the market for xAI's future success is approximately $700 billion to $800 billion, which has significantly compressed from approximately $1.5 trillion at its peak.
At the current price of $131, it has entered the vicinity of the lower bound of its medium-to-long-term reasonable range, offering a better risk-reward ratio than during its peak. However, the confidence of this assessment depends on Starlink's Q2 user data and the stability of AI computing contracts with the likes of Anthropic.
This content was translated using AI and reviewed for clarity. It is for informational purposes only.
Recommended Articles









Comments (0)
Click the $ button, enter the symbol, and select to link a stock, ETF, or other ticker.