


SanDisk Pulls Back Into a Descending Channel at $1,467 — Long on Support or Short the Breakdown?



AI Podcast


SanDisk (SNDK) trades in a descending channel, with critical support at $1,436, a 50% Fibonacci level. Sellers dominate rallies and higher volume on down days indicates downward momentum. Despite technical weakness, strong Q3 FY2026 revenues ($5.95 billion) and a $42 billion backlog support the fundamental bull case. A break below $1,436 targets $1,370, while a hold and rebound could reach $1,546-$1,600. A catalyst may emerge from Q4 earnings or hyperscaler reports.
TradingKey - SanDisk SNDK at $1,467 in descending channel from $1,678 May highs. 50% Fib at $1,436 is critical support. RSI 51–64, neutral. Channel breakdown targets $1,370. Long recovery targets $1,546–1,600.
SanDisk Corporation (NASDAQ: SNDK) is currently at $1,466.97, forming a multiple lines descending channel on the 2H chart following a pullback off its May high of near $1,678. Buyers have tried to defend support at $1,436 to $1,465, which appears with varying amounts of wicks, but sellers have been in control of all the rallies back to the mid-channel resistance area of $1,480 to $1,546. The volume has also been higher on the red days than on the green ones, which is one of the first signs that short-term momentum is leaning towards the sellers.
The fundamental thesis is also good, as the third quarter of fiscal 2026 results came in above expectations of $5.95 billion in revenues (251% growth year over year) and a backlog of $42 billion. The charts here give us two trades, which is to buy the support hold or sell the breakdown. It will all depend on the action at $1,436.
SanDisk: What the multiple lines descending channel on the 2H chart is telling you?
The price of SanDisk stock peaked near the $1,678 in early May and has been making lower tops and bottoms as seen on the 2H chart as it has been trading inside a clear parallel descending channel. This channel is made of multiple blue colored channels and the red descending trendlines from the $1,678 high is capping rallies in the range of $1,480 to $1,546 as of writing. The channel support is at the range of $1,436 to $1,465 which is the current trading zone. Below this, the channel support line in black is at the price of $1,370 and this also aligns with the red moving average dynamic support and a previous structure area as well.
The 50% Fibonacci area from the previous swing low to the $1,678 high sits at $1,436, reinforcing the support area here. Additionally, the RSI at 51.50 to 64.14 is neither oversold nor overbought but is still trending to the upside. This means the downside could still continue if there is a breakdown below channel support. Volume is an indication that sellers are still active as the price comes down, but buyers have not stepped in to sustain the higher prices. The rallies are not seeing the increase in volumes like the price decline. This has led to the mid-channel resistance at $1,480 to $1,546 to remain in place.
This is the sign that the price may not rise further. This is the distribution channel that is being formed as the price declines while the sellers are using the rallies to exit. However, the stock prices could not decline forever. But this is a good sign of the trend to the downside and the buyers will have to show a rally with higher volumes before the descending channel could be considered as broken.
Why the fundamental bull case on SanDisk is alive at prices below $1,467?
We also need to take the technicals and the fundamentals into consideration here while evaluating SanDisk Corporation’s stock as the third quarter results came in very high on a quarter-end basis at $5.95 billion in revenues compared to guidance of $4.8 billion and 78.4% non-GAAP gross margins and $23.41 (non-GAAP) EPS compared to guidance of $12 to $14 (weighted average midpoint). The company is guiding for Q4 earnings at $7.75 to $8.25 billion, an acceleration from the prior quarter.
The backlog of $42 billion provides a high degree of revenue certainty, as it has a multi-year visibility and is not related to any short-term prices. The decline from the high of $1,678 to the current price of $1,467 is a correction of 13% in a stock which is up more than 500% so far in 2026. Generally, the correction on a strong uptrend comes in at 10% to 20% on a stock that is up strongly before the price resumes its uptrend. In this regard, this decline looks to be a technical correction in a fundamental uptrend.
If the companies in the hyperscaler category come in with lower guidance or comment that there is no growth in the demand for SSD for the AI data centers in their earnings this quarter, the bull case could change and the fundamental outlook could turn bearish on the SanDisk stock.
Long on SanDisk on the support hold and short on a breakdown below channel support
The level at $1,436 will decide on the direction of the next trade in SanDisk stock. If the price bounces back up and goes up with the higher volumes, it has the ability to test the area of $1,480 to $1,546, which could resolve the descending channel to the upside, and the price could go up and form a new ascending channel that is similar to that formed in May from $1,043, with its first resistance at $1,600 and the prior high at $1,677.
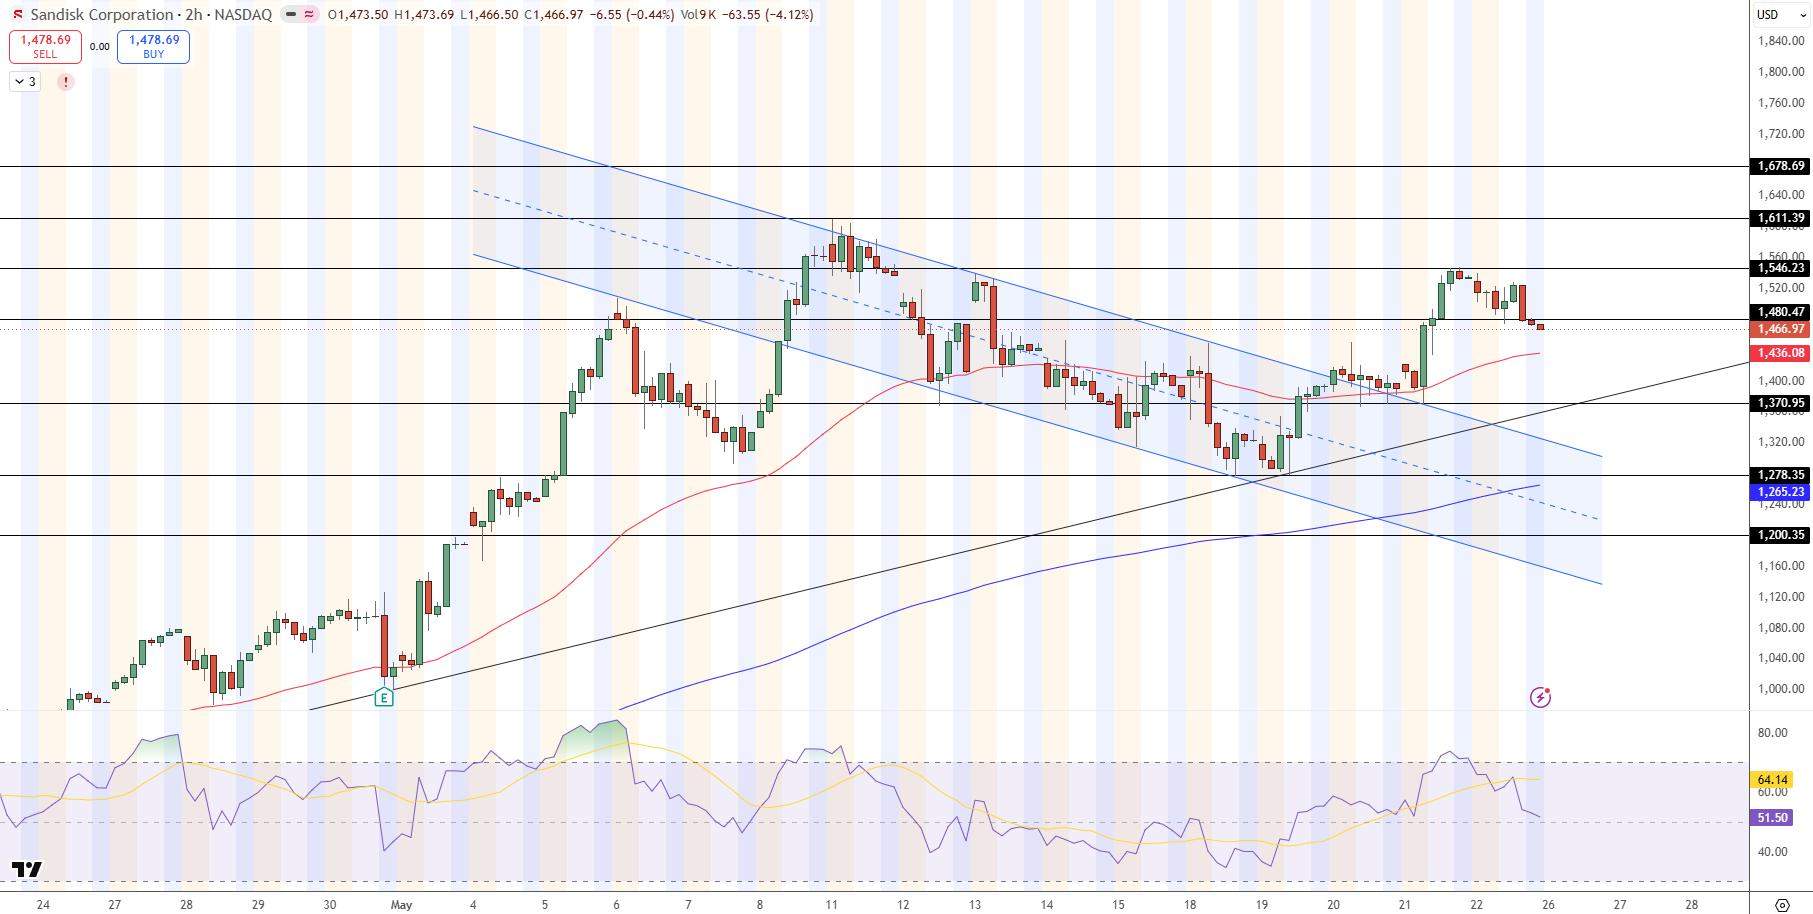
SanDisk Corporation (NASDAQ: SNDK) Price Chart - Source: Tradingview
So, the entry to the buy trade in SanDisk stocks would come when the price bounces back up from the level with the higher volumes. Otherwise, the trade would wait until $1,480.
Long (buy) trade:
- Trigger: Price bounces back up at $1,480 with increasing volume
- Target 1: The price to the resistance level of $1,546
- Target 2: $1,600 to $1,677 area.
- Stop loss: Daily close below $1,436 (50% Fibonacci area and channel support)
Short (sell) trade:
- Trigger: Close below $1,436 with higher volume.
- Target 1: The price to $1,370 area (channel support and MA support)
- Target 2: The price to $1,280 area (previous structural support)
- Stop loss: Close above $1,480 (breakdown failure).
What accounts for SanDisk's pullback from recent May peaks?
On the 2H timeframe, SNDK is retracing in a fairly well-defined descending channel, after briefly touching 1678$. Selling volume has been higher on down-days than up-days and a rebound attempt toward the middle of the 1480 to 1546$ channel failed.
SNDK's correction has followed similar corrections in high momentum semiconductor names as traders reduced exposure to those after an above-expected inflation report for the US and reduced expectations for the near term rate cut.
All of the fundamental numbers (Q3 FY2026 revenue of $5.95 billion, 78.4% gross margin, 42B$ contract backlog, and Q4 guidance of $7.75 to $8.25 billion) is the same.
What is the key support level of May 2026?
The main near-term support is $1436, which is the lower part of the 2H descending channel and also the 50% retracement from the last swing bottom to the $1678 high in May.
If $1436 holds and the rebound happens with volume we can look to $1480 to $1546 as the first target, $1600 to $1677 is the bullish target. If $1436 is closed below and continues to fall we can look for a move towards the black support $1370 and eventually $1280 if it is sustained.
Should I buy or sell SanDisk stock at $1467?
We have a long and a short position available from the $1467 level. If we receive a volume-based confirmation of a rebound on a break above $1480, then we are looking for a long trade to $1546 and $1600 to $1677, stop under $1436. Or if $1436 is closed below and is confirmed by increased volume, we are looking for a short position to $1370 and $1280, stop over $1480. Taking a position at this point without waiting for the volume-based confirmation is essentially trying to predict the future instead of responding. The evidence is presented to us at $1436.
Bottom line
From $1678 to $1467 it was a 13% correction. The chart shows a relatively well-organized descending channel where sellers are in charge of the short-term trend and the volumes confirms it. Fundamental anchor (Q3 FY2026 revenue of $5.95 billion, 78.4% gross margin, $42B contract backlog, Q4 guidance of $7.75 to $8.25 billion) didn't change. The $ 1436 level is the fulcrum of the price action: if $1436 level holds and we see rebound on volume, a good long trade could be $1546 to $1677. But if $1436 is closed below and the level is confirmed with larger volumes, we can be looking for a short trade to $1370 to $1280.
Until this is resolved, neither position is really active. July will have Q4 earnings and possibly a few capex reports from hyperscalers which may be the fundamental catalyst to either validate this correction in a bullish trend or to confirm the start of something bigger.
Recommended Articles










Comments (0)
Click the $ button, enter the symbol, and select to link a stock, ETF, or other ticker.